Imaging Articular Cartilage for Surgical Decision-Making
- Normal articular cartilage is 2-4mm thick and appears as a smooth, intermediate-signal layer on most sequences.
- PD fat-suppressed and T2 fat-suppressed are the standard sequences for morphological cartilage assessment.
- MRI is highly sensitive (70-95%) for full-thickness cartilage defects but less reliable (40-70%) for partial-thickness lesions.
- T2 mapping and dGEMRIC are quantitative techniques that detect biochemical cartilage changes BEFORE morphological damage is visible.
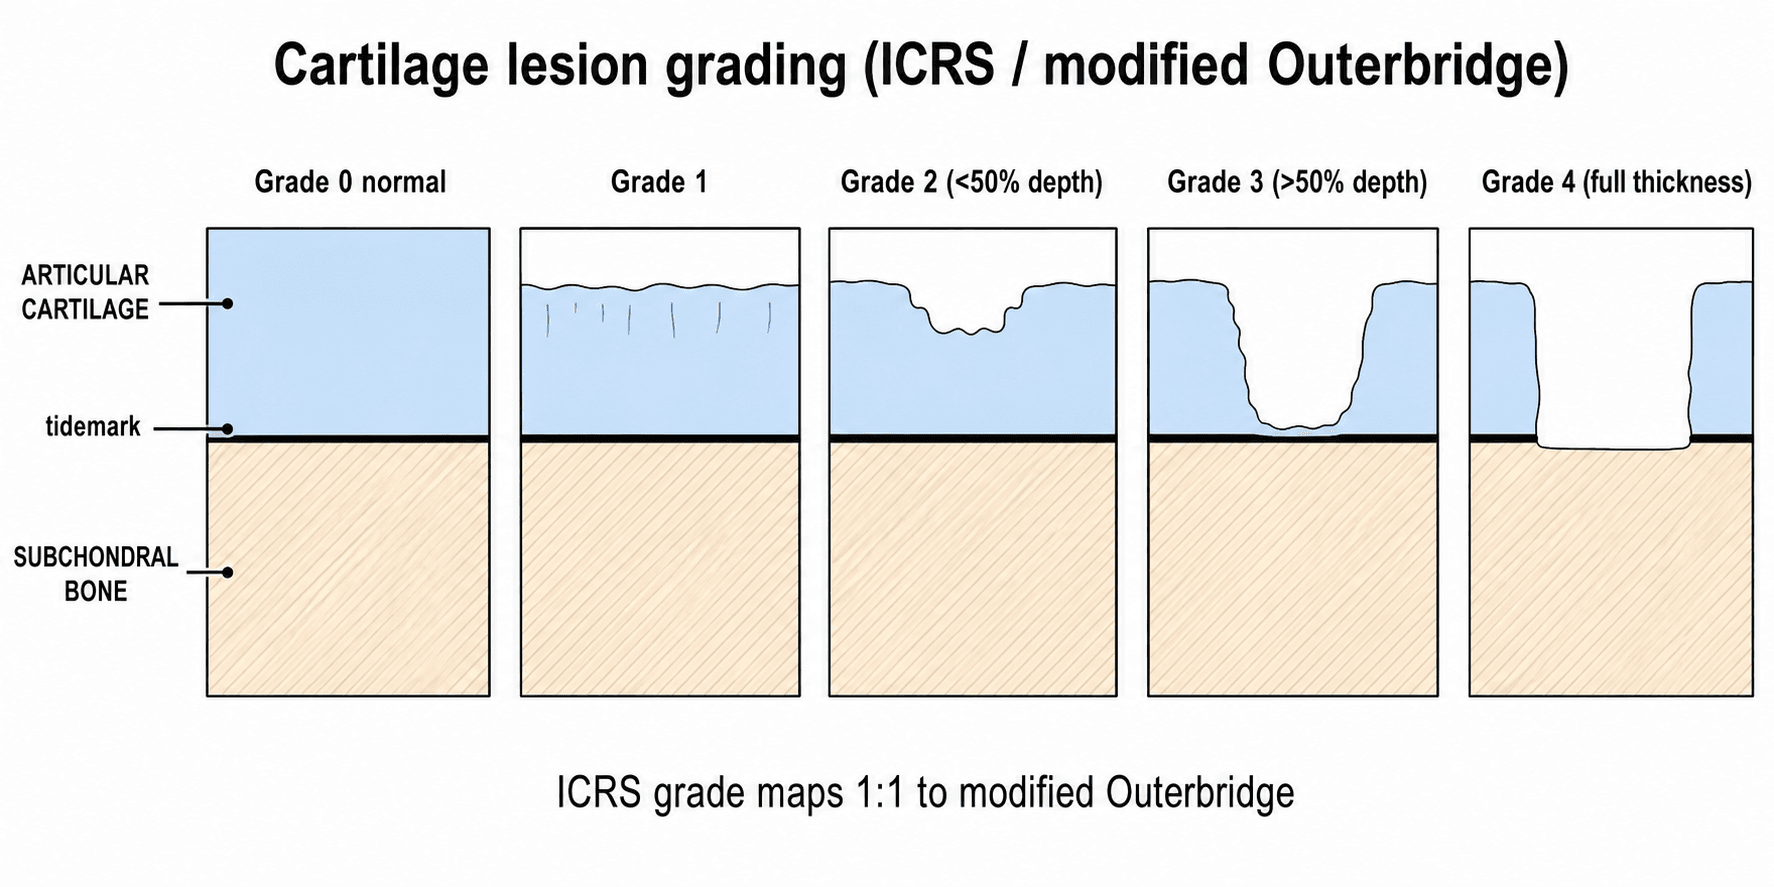
- The modified Outerbridge classification (Grades 0-4) is used to grade cartilage lesions on MRI.
- “3T MRI provides superior cartilage imaging compared to 1.5T due to improved signal-to-noise ratio and spatial resolution.
- “MR arthrography (direct, with intra-articular gadolinium) improves detection of partial-thickness cartilage lesions.
- “Normal cartilage shows a layered appearance on high-resolution imaging: the deep radial zone has lower signal than the superficial transitional zone.
- “Post-cartilage repair MRI (MOCART score) assesses: fill grade, integration, surface, signal, subchondral bone, effusion.
- “Cartilage cannot heal spontaneously — even small defects will progress without intervention, making early detection critical.
MRI cartilage assessment is commonly examined in the context of knee and hip pathology. You must be able to: explain optimal sequences for cartilage imaging, grade cartilage lesions using the modified Outerbridge classification, discuss the role of quantitative techniques (T2 mapping, dGEMRIC), and explain how MRI findings guide surgical decision-making between microfracture, OATS, and ACI. A common exam trap is overestimating the sensitivity of MRI for partial-thickness lesions.
SOFBECartilage MRI Grading
Hook:SOFBE: Signal, One-half, Full, Bone, Eburnation — the progression of cartilage destruction on MRI.
FISSBEMOCART Score Components
Hook:FISSBE is the MOCART score framework for assessing cartilage repair on follow-up MRI.
Overview
Articular cartilage is a unique tissue that lacks intrinsic healing capacity due to its avascular nature and limited chondrocyte proliferative potential. Once damaged, cartilage defects tend to progress to larger lesions and eventually to osteoarthritis. MRI is the primary non-invasive modality for assessing articular cartilage, providing information about defect size, depth, location, and the condition of surrounding subchondral bone that guides surgical decision-making.
The challenge of cartilage MRI is that the tissue is thin (2-4mm), has subtle internal structural variation, and partial-thickness lesions can be difficult to distinguish from normal signal heterogeneity. This has driven the development of dedicated high-resolution cartilage sequences and quantitative imaging techniques that can detect biochemical changes in cartilage before macroscopic damage occurs.
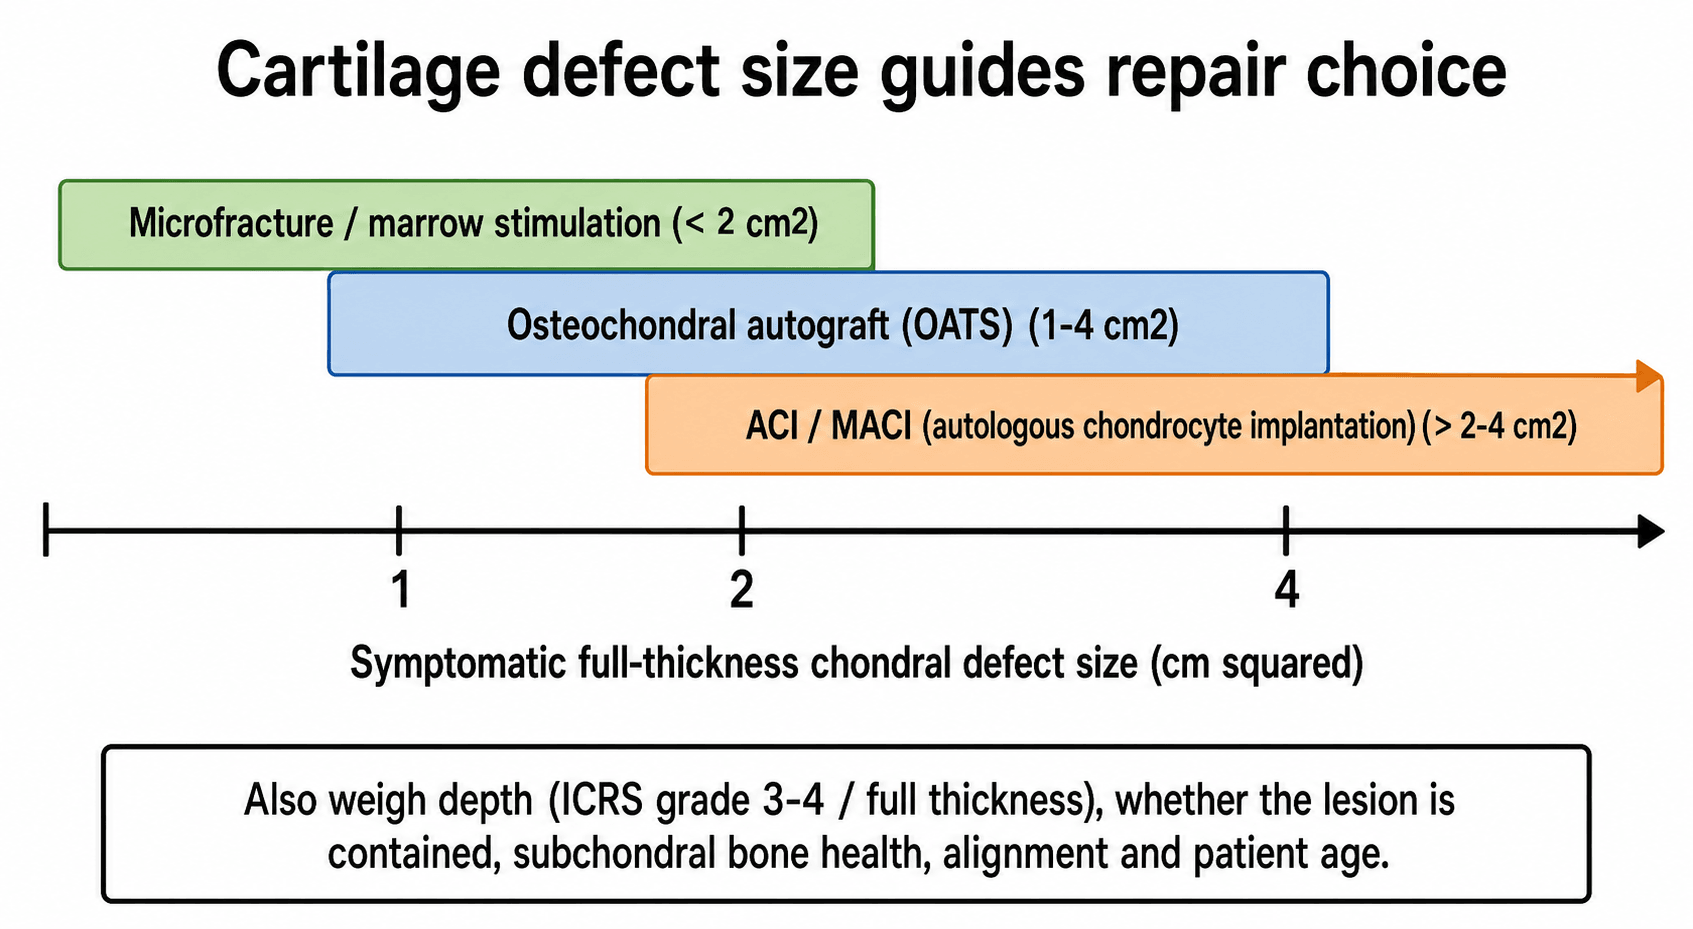
Cartilage defects of greater than 2cm² in the weight-bearing zone of the knee produce symptoms and risk progression to osteoarthritis. Treatment options depend on defect characteristics: microfracture for smaller defects (less than 2cm²), osteochondral autograft transfer (OATS) for 1-4cm² defects, and autologous chondrocyte implantation (ACI/MACI) for larger defects (greater than 2-4cm²). MRI provides the preoperative defect characterisation needed for surgical planning.
Arthroscopy remains the gold standard for cartilage assessment — it allows direct visualisation, probing of the cartilage surface, and immediate treatment. However, MRI has the advantage of being non-invasive, showing the full extent of subchondral bone changes, revealing marrow oedema, and assessing areas inaccessible to the arthroscope. The correlation between MRI and arthroscopic findings is best for full-thickness defects (70-95% sensitivity) but less reliable for partial-thickness lesions (40-70% sensitivity).
ICRS Cartilage Lesion Classification
The modified Outerbridge grades above are the most widely quoted, but the topic also invokes the ICRS (International Cartilage Repair Society) grade, which is the international reporting standard used at arthroscopy and increasingly applied to MRI - examiners expect you to know both and how they map onto each other.
- Description
- Normal cartilage
- Modified Outerbridge equivalent
- Grade 0
- Description
- Intact surface - 1a soft indentation/fibrillation, 1b superficial fissures and cracks
- Modified Outerbridge equivalent
- Grade 1 (signal change, intact surface)
- Description
- Defect extending less than 50 percent of cartilage depth
- Modified Outerbridge equivalent
- Grade 2
- Description
- Defect more than 50 percent of depth, down to but not through the calcified layer/subchondral bone
- Modified Outerbridge equivalent
- Grade 3
- Description
- Full-thickness defect breaching the subchondral bone plate
- Modified Outerbridge equivalent
- Grade 4
The ICRS system is more granular (the 1a/1b and 3a-d subdivisions), is the international standard for describing lesions in cartilage-repair reporting and registries (e.g. the German Cartilage Registry), and has a separate ICRS OCD scheme for osteochondral lesions. In a viva, grade the lesion in both systems and quote the depth thresholds - less than 50 percent (Grade 2) versus more than 50 percent (Grade 3) versus full-thickness to bone (Grade 4) - which are shared by both classifications.
Systematic Approach
Systematic Cartilage Assessment on MRI
- Assessment
- PD-FS or T2-FS is most appropriate for cartilage morphology
- Key Considerations
- Cartilage appears intermediate grey; fluid appears bright — this contrast is essential for detecting surface defects
- Assessment
- Compare thickness across the articular surface; note focal thinning
- Key Considerations
- Normal thickness varies by location: femoral condyle 2-3mm, patellar surface 3-5mm (thickest), tibial plateau 2-3mm
- Assessment
- Apply modified Outerbridge classification (Grades 0-4)
- Key Considerations
- Grade 1: signal change only. Grade 2: less than 50% depth. Grade 3: more than 50% depth. Grade 4: full-thickness with bone exposure
- Assessment
- Document the size (AP dimension, width, and depth in mm)
- Key Considerations
- Size determines treatment: less than 2cm² = microfracture, 1-4cm² = OATS, more than 2-4cm² = ACI/MACI
- Assessment
- Look for oedema, cysts, sclerosis beneath the cartilage defect
- Key Considerations
- Subchondral changes indicate chronicity and may affect surgical outcomes — large cysts may require bone grafting
- Assessment
- Meniscal tears, ligament injuries, loose bodies, alignment
- Key Considerations
- Cartilage defects rarely occur in isolation — associated pathology must be addressed simultaneously
Cartilage Imaging Sequences
Standard Cartilage Imaging
PD fat-suppressed is the workhorse sequence for cartilage morphological assessment. It provides:
- High signal-to-noise ratio (long TR, short TE)
- Good cartilage-fluid contrast (cartilage is intermediate; fluid is bright)
- Sensitivity to surface defects and partial-thickness lesions
- Fat suppression eliminates competing signal from epiphyseal fat and marrow
3D Gradient Echo sequences (SPGR, FLASH, DESS, MERGE) provide isotropic thin-slice acquisitions (0.5-1mm) that enable multiplanar reformatting and quantitative thickness mapping. These are increasingly used for:
- Research studies requiring volumetric cartilage measurement
- Pre- and post-operative cartilage repair monitoring
- Cartilage thickness maps overlaid on 3D joint models
T2-weighted fat-suppressed can also be used for cartilage but has lower SNR than PD and may underestimate the extent of lesions that are better seen with PD contrast.
3T vs 1.5T: Higher field strength significantly improves cartilage imaging quality by increasing SNR and spatial resolution. 3T is preferred for dedicated cartilage assessment when available.
These remain the standard for clinical cartilage assessment.

PIGOptimal Cartilage Sequences
Hook:PIG sequences for cartilage: PD fat-suppressed is the workhorse, 3D GRE for quantitative mapping, and Gadolinium arthrography for tricky partial-thickness defects.
Cartilage Repair Assessment
Monitoring cartilage repair on MRI is increasingly important as the number of cartilage repair procedures grows. The MOCART (Magnetic Resonance Observation of Cartilage Repair Tissue) score is the standardised tool for post-operative cartilage repair assessment. The original MOCART has since been refined into MOCART 2.0, which redefines several variables (fill, integration, surface, structure, signal, bone, subchondral changes) on a clearer point scale, but the underlying assessment framework is unchanged.
- Best Outcome
- Complete fill (100%)
- Intermediate
- Over-fill (hypertrophic) or slight under-fill (75-100%)
- Worst Outcome
- Significant under-fill (less than 50%) or complete graft failure
- Best Outcome
- Complete integration — no visible cleft between repair and native cartilage
- Intermediate
- Partial integration — incomplete border with focal cleft
- Worst Outcome
- No integration — persistent cleft, delamination
- Best Outcome
- Smooth surface, flush with native cartilage
- Intermediate
- Irregular surface, mild fibrillation
- Worst Outcome
- Fissured, severely irregular, or absent surface
- Best Outcome
- Isointense to native cartilage on all sequences
- Intermediate
- Mild hyperintensity (suggests more fibrous composition)
- Worst Outcome
- Markedly abnormal signal (suggests failure or fibrocartilage only)
- Best Outcome
- Intact subchondral lamina with normal marrow
- Intermediate
- Mild irregularity or oedema
- Worst Outcome
- Subchondral overgrowth, large cysts, or persistent osteolysis
On MRI, true hyaline cartilage repair tissue is isointense to surrounding native cartilage on all sequences. Fibrocartilage repair (as produced by microfracture) tends to have slightly different signal characteristics: often mildly hyperintense on PD/T2 with a less distinct layered appearance. This signal difference can help distinguish the type of repair tissue, which has prognostic implications — hyaline-like repair (from ACI/MACI) generally has better long-term durability than fibrocartilage.
Cartilage MRI Beyond the Knee
Most of this topic is knee-centric, but it repeatedly invokes the hip and ankle, and the joint-specific differences are examinable. The governing rule is that cartilage gets thinner and more curved away from the knee, which lowers sensitivity and makes high-resolution 3T imaging and arthrography more important.
- Cartilage feature
- Thin, sharply curved acetabular and femoral cartilage; closely related to the labrum
- Imaging approach and use
- MR arthrography (often with traction) for cartilage and labral assessment; dGEMRIC and T2 mapping are classically used in dysplasia and femoroacetabular impingement to gauge cartilage quality before joint preservation
- Cartilage feature
- Thinner (around 1 to 1.6 mm) but stiffer cartilage
- Imaging approach and use
- Assess osteochondral lesions of the talus for size, depth, subchondral cyst and stability; high-resolution and arthrography improve detection
- Cartilage feature
- Very thin glenohumeral cartilage
- Imaging approach and use
- Hardest joint to assess; MR arthrography helps outline subtle surface defects
The classic non-knee use of compositional cartilage MRI is in the hip: a low dGEMRIC index (GAG depletion) in hip dysplasia or femoroacetabular impingement predicts a poorer outcome from joint-preserving surgery such as periacetabular osteotomy, so it can inform whether to preserve or replace the joint. Remember that the thinner cartilage at the hip, ankle and shoulder makes dedicated high-resolution sequences and arthrography more important than at the knee.
Differential Diagnosis & Imaging Pitfalls
A focal cartilage signal abnormality or apparent defect on MRI has several mimics. Distinguishing a true chondral lesion from an artefact or a normal variant is a high-yield exam discriminator.
- Typical Appearance
- Focal cartilage loss; fluid tracks into defect on PD-FS/T2; underlying marrow oedema or cyst
- Distinguishing Feature
- Reproduces on two orthogonal planes; correlates with subchondral change
- Typical Appearance
- Increased intracartilaginous signal where collagen lies at 55° to B0 (e.g. posterior femoral condyle on short-TE sequences)
- Distinguishing Feature
- Disappears or lessens on long-TE (T2) sequences; no surface breach or subchondral change
- Typical Appearance
- Apparent thinning at curved surfaces from thick slices or oblique sampling
- Distinguishing Feature
- Resolves on thin-slice/3D isotropic imaging; no fluid cleft
- Typical Appearance
- Layered appearance — lower-signal deep radial zone, higher-signal transitional zone
- Distinguishing Feature
- Smooth, uniform, follows expected zonal pattern; intact surface
- Typical Appearance
- Subchondral fragment with high-signal interface; may have overlying cartilage defect
- Distinguishing Feature
- Fluid/granulation at the fragment interface signals instability — key surgical determinant
- Typical Appearance
- Subchondral low-signal line with extensive marrow oedema, often medial femoral condyle in older patients
- Distinguishing Feature
- Subchondral line and oedema dominate; overlying cartilage may initially be intact
- Typical Appearance
- Low-signal foci within cartilage (calcium pyrophosphate)
- Distinguishing Feature
- Linear/punctate low signal paralleling the surface; correlate with radiograph/CT
The single most examined pitfall is the magic-angle effect causing artefactual high signal in curved cartilage (classically the posterior femoral condyle) on short-TE sequences such as PD or gradient echo. If a "lesion" vanishes on the T2-weighted sequence and there is no surface breach or subchondral change, suspect magic angle rather than true pathology.
Guidelines, Registries & Global Practice
Global Epidemiology
Focal chondral and osteochondral lesions are found in 60-66% of knee arthroscopies in mixed populations, and full-thickness (Outerbridge/ICRS Grade III-IV) defects in roughly 5-11% — frequently in young, active patients. Untreated symptomatic full-thickness defects greater than 2cm² in the weight-bearing zone progress toward osteoarthritis, making accurate non-invasive characterisation a global priority across exam syllabuses.
Side-by-Side Society Guidance
- Imaging Recommendation
- ICRS cartilage lesion classification on MRI and arthroscopy; dedicated cartilage sequences for grading and sizing
- Repair Threshold Emphasis
- Defect size, depth, containment and bipolar status drive technique choice
- Imaging Recommendation
- MRI to characterise symptomatic chondral lesions before surgery; recognises MRI under-detects partial-thickness disease
- Repair Threshold Emphasis
- Limited strong evidence to favour one repair over another; shared decision-making
- Imaging Recommendation
- MRI for suspected internal derangement and chondral injury; ACI/MACI recommended (TA477) for defined defects without significant OA
- Repair Threshold Emphasis
- Autologous chondrocyte implantation for symptomatic defects (typically over 2cm²) and minimal OA
- Imaging Recommendation
- Standardised MRI protocols (PD-FS plus a 3D cartilage sequence); MOCART/MOCART 2.0 for repair follow-up
- Repair Threshold Emphasis
- Consensus algorithms by lesion size (microfracture/AMIC for small, OAT, ACI/MACI for larger)
Registry & Resource-Setting Variation
- Registries: Cartilage repair is captured in dedicated registries such as the German Cartilage Registry (KnorpelRegister DGOU) and the Swedish/UK cartilage cohorts; large joint registries (NJR UK, AJRR US, AOANJRR Australia, SHAR Sweden) track downstream arthroplasty, where early cartilage treatment is a strategy to delay replacement.
- High-resource settings: 3T scanners, dedicated 3D cartilage sequences and quantitative mapping (T2, T1rho, dGEMRIC) are increasingly available; MACI and matrix-based techniques are offered in specialist centres.
- Limited-resource settings: 1.5T (or lower) MRI with PD-FS is the practical standard; advanced cell-based repair and quantitative imaging are often unavailable, so management leans on microfracture/marrow stimulation and clinical-radiographic correlation. Examiners worldwide expect candidates to reason from defect size, depth and patient factors rather than from access to any single technology.
Controversies & Areas of Uncertainty
T2 mapping, T1rho and dGEMRIC reliably detect compositional change, but lack of standardised thresholds, scanner-to-scanner variation, the magic-angle effect (T2) and gadolinium-stewardship concerns (dGEMRIC) keep them largely research tools rather than routine clinical decision aids.
Arthroscopy is the traditional reference standard but only assesses the surface and cannot probe subchondral bone or composition; it also has its own interobserver variability. There is debate over whether high-resolution 3T MRI should now be considered the practical standard for sizing and grading before surgery.
MOCART correlates with short-term clinical scores, but the link between repair-tissue morphology/signal and durable long-term function is inconsistent — good MRI appearance does not guarantee good symptoms, and vice versa. MOCART 2.0 aims to improve this but long-term validation is ongoing.
Asymptomatic chondral lesions are common, especially with age. Whether an MRI-detected defect is the symptom generator must be judged against the clinical picture; over-treating incidental lesions is a recognised risk.
Clinical Decision Scenarios
Practise clinical reasoning and management decisions out loud
“A 28-year-old footballer has an MRI showing a 3cm² full-thickness cartilage defect on the medial femoral condyle with underlying subchondral oedema.”
“An examiner asks you about quantitative MRI techniques for assessing cartilage health beyond standard morphological imaging.”
“You review a follow-up MRI 12 months after ACI/MACI of the medial femoral condyle. The repair tissue is hyperintense on PD-FS compared to the surrounding native cartilage.”
Optimal Sequences
- PD fat-suppressed: standard morphological cartilage sequence
- 3D GRE (SPGR/FLASH/DESS): thin isotropic slices for quantitative mapping
- MR arthrography: improves partial-thickness defect detection (85-92% sensitivity)
- 3T preferred over 1.5T for cartilage assessment
Outerbridge MRI Grading
- Grade 0: Normal cartilage
- Grade 1: Signal change, intact surface (softening)
- Grade 2: Partial-thickness less than 50% depth
- Grade 3: Partial-thickness more than 50% depth or full-thickness without bone
- Grade 4: Full-thickness with exposed subchondral bone
Treatment by Defect Size
- Less than 2cm²: Microfracture (fibrocartilage result)
- 1-4cm²: OATS (true hyaline cartilage, donor site morbidity)
- More than 2-4cm²: ACI/MACI (hyaline-like repair, two-stage)
- Always address alignment (HTO), meniscal status, and ligament stability
Quantitative Techniques
- T2 mapping: collagen integrity and water content (non-invasive, no contrast)
- dGEMRIC: GAG content (requires IV gadolinium + 90-min delay)
- T1rho: proteoglycan content (research, not widely available)
- All detect biochemical changes BEFORE morphological damage
MOCART Score (Post-Repair)
- Fill grade, Integration, Surface, Signal, Bone interface, Effusion
- Isointense signal to native cartilage = best outcome
- Hyperintense signal = more fibrocartilaginous or immature
- Fill grade and integration are strongest outcome predictors
Evidence Base
Diagnostic Performance of MRI for Knee Articular Cartilage
- Across 14 Level I and 13 Level II studies, MRI sensitivity for identifying knee articular cartilage abnormalities ranged widely from 26% to 96% (specificity 50-100%, accuracy 49-94%).
- For detecting EARLY osteoarthritis specifically, sensitivity was even more variable at 0-86% — confirming MRI under-detects early/partial cartilage change.
- Heterogeneity of MRI sequences and field strengths was so great that a formal meta-analysis could not be performed.
Fat-Suppressed 3D SPGR vs Standard MRI for Cartilage Defects
- In 48 patients with arthroscopic correlation, sagittal fat-suppressed 3D SPGR was far more sensitive for hyaline cartilage defects than standard MRI (75-85% versus 29-38%, p less than 0.001) with equal specificity (97% versus 97%).
- One quarter of patients had isolated cartilage lesions clinically mistaken for meniscal tears that were missed on standard sequences but seen on SPGR.
- Combining standard and SPGR images gave no added diagnostic advantage over SPGR alone (sensitivity 86%, specificity 97%).
A dedicated 3D gradient-echo cartilage sequence roughly doubles defect detection versus routine knee MRI; full-thickness loss is detected far more reliably than partial-thickness change.