Choosing the Right Sequence for Each Clinical Question
T1-weighted: Short TR (400-600ms), Short TE (10-20ms) → Anatomy, fat, gadolinium
T2-weighted: Long TR (3000-6000ms), Long TE (80-120ms) → Pathology, fluid, oedema
PD-weighted: Long TR (2000-4000ms), Short TE (10-30ms) → Meniscus, cartilage, ligament detail
STIR: TI = 160ms (1.5T), Long TR, Intermediate TE → Bone marrow oedema, most sensitive fluid detection
GRE (T2*): Short TR, Variable TE, Flip angle → Cartilage surface, haemosiderin, loose bodies
Key: TR controls T1 contrast, TE controls T2 contrast — this relationship governs all sequence selection
- Pulse sequence selection determines what pathology you can see — the wrong sequence can hide the diagnosis.
- T1-weighted (short TR, short TE): anatomy, fat, subacute blood. Post-gadolinium enhancement seen on T1.
- T2-weighted (long TR, long TE): fluid and oedema detection. Pathology is bright — the 'pathology sequence'.
- Proton Density (long TR, short TE): optimal for meniscal and cartilage assessment. High SNR.
- STIR: fat suppression via inversion — most sensitive for bone marrow oedema, robust near metal.
- “TR controls T1 weighting (short TR = T1); TE controls T2 weighting (long TE = T2).
- “PD-weighted images have the highest signal-to-noise ratio — making them optimal for detecting subtle meniscal tears.
- “STIR nulls fat at a specific inversion time (TI approximately 160ms at 1.5T) — provides uniform fat suppression.
- “Gradient echo sequences are susceptible to metal and field inhomogeneity — avoid near implants.
- “Magic angle artefact: tendons at 55 degrees to B0 appear bright on short TE sequences (T1, PD) but NOT on T2.
Overview
Why the sequence matters. Pulse sequence selection is the decision that determines whether pathology will be visible on the resulting images. Each sequence produces a different image contrast by manipulating the timing parameters (TR, TE, TI, flip angle) that govern how tissue relaxation properties contribute to the final signal, and choosing the wrong sequence for a clinical question can render the diagnosis invisible.
The core set. In orthopaedic practice the sequences used routinely are T1-weighted, T2-weighted, proton density (PD)-weighted, STIR and gradient echo (GRE). Diffusion-weighted imaging (DWI), dynamic contrast-enhanced (DCE) MRI and quantitative mapping are increasingly used for specific indications.
TR and TE. TR, the repetition time, is the time between successive RF excitation pulses; TE, the echo time, is the time between the RF pulse and signal measurement. TR controls T1 contrast: a short TR does not allow complete T1 recovery, so tissues with a short T1, such as fat, produce more signal and are bright. TE controls T2 contrast: a long TE allows more T2 decay, so tissues with a long T2, such as water, retain signal and are bright.
- Short TR (less than 600ms) gives T1 weighting; long TR (more than 2000ms) gives T2 or PD weighting
- Short TE (less than 30ms) gives T1 or PD weighting; long TE (more than 60ms) gives T2 weighting
A T1-weighted image therefore uses short TR and short TE, a T2-weighted image long TR and long TE, and a PD-weighted image long TR and short TE, which maximises signal-to-noise ratio while minimising both T1 and T2 contrast.
Each question has an optimal sequence. A meniscal tear is best seen on PD, with its high SNR for fibrocartilage. Bone marrow oedema is best detected by STIR, the most sensitive sequence for fluid signals. A rotator cuff tear is best characterised on T2, where fluid fills the torn tendon gap. Gadolinium enhancement for tumour and infection requires T1 post-contrast.
The protocol. Standard orthopaedic MRI protocols include at least three sequences in two planes, typically T1, T2/PD and STIR in the sagittal and coronal planes for most joints, with axial images added for specific indications. The radiologist selects the protocol, but the referring orthopaedic surgeon should specify the clinical question so that the correct sequences are included.
Systematic Approach
When ordering or interpreting an orthopaedic MRI, work through the six steps.
- Action
- What specific pathology are you looking for?
- Rationale
- Different pathologies require different sequences — a meniscal tear protocol differs from a tumour staging protocol
- Action
- Which planes best demonstrate the suspected pathology?
- Rationale
- Sagittal for ACL and meniscus; coronal for MCL, LCL, and rotator cuff; axial for labrum and peroneal tendons
- Action
- T1 (anatomy) + T2 or STIR (pathology) + PD (if meniscus/cartilage)
- Rationale
- These three categories cover the vast majority of orthopaedic diagnostic needs
- Action
- Gadolinium for tumour, infection, or synovitis
- Rationale
- T1 fat-suppressed post-contrast; consider dynamic contrast-enhanced for tumour vascularity
- Action
- MAVRIC-SL, SEMAC, spin echo over gradient echo, STIR over chemical fat sat
- Rationale
- Standard protocols fail near metal implants — specific modifications are required
- Action
- Do not interpret a single sequence in isolation
- Rationale
- T1 alone misses oedema; T2 alone misses fatty infiltration. Cross-reference findings across sequences
Core Sequences
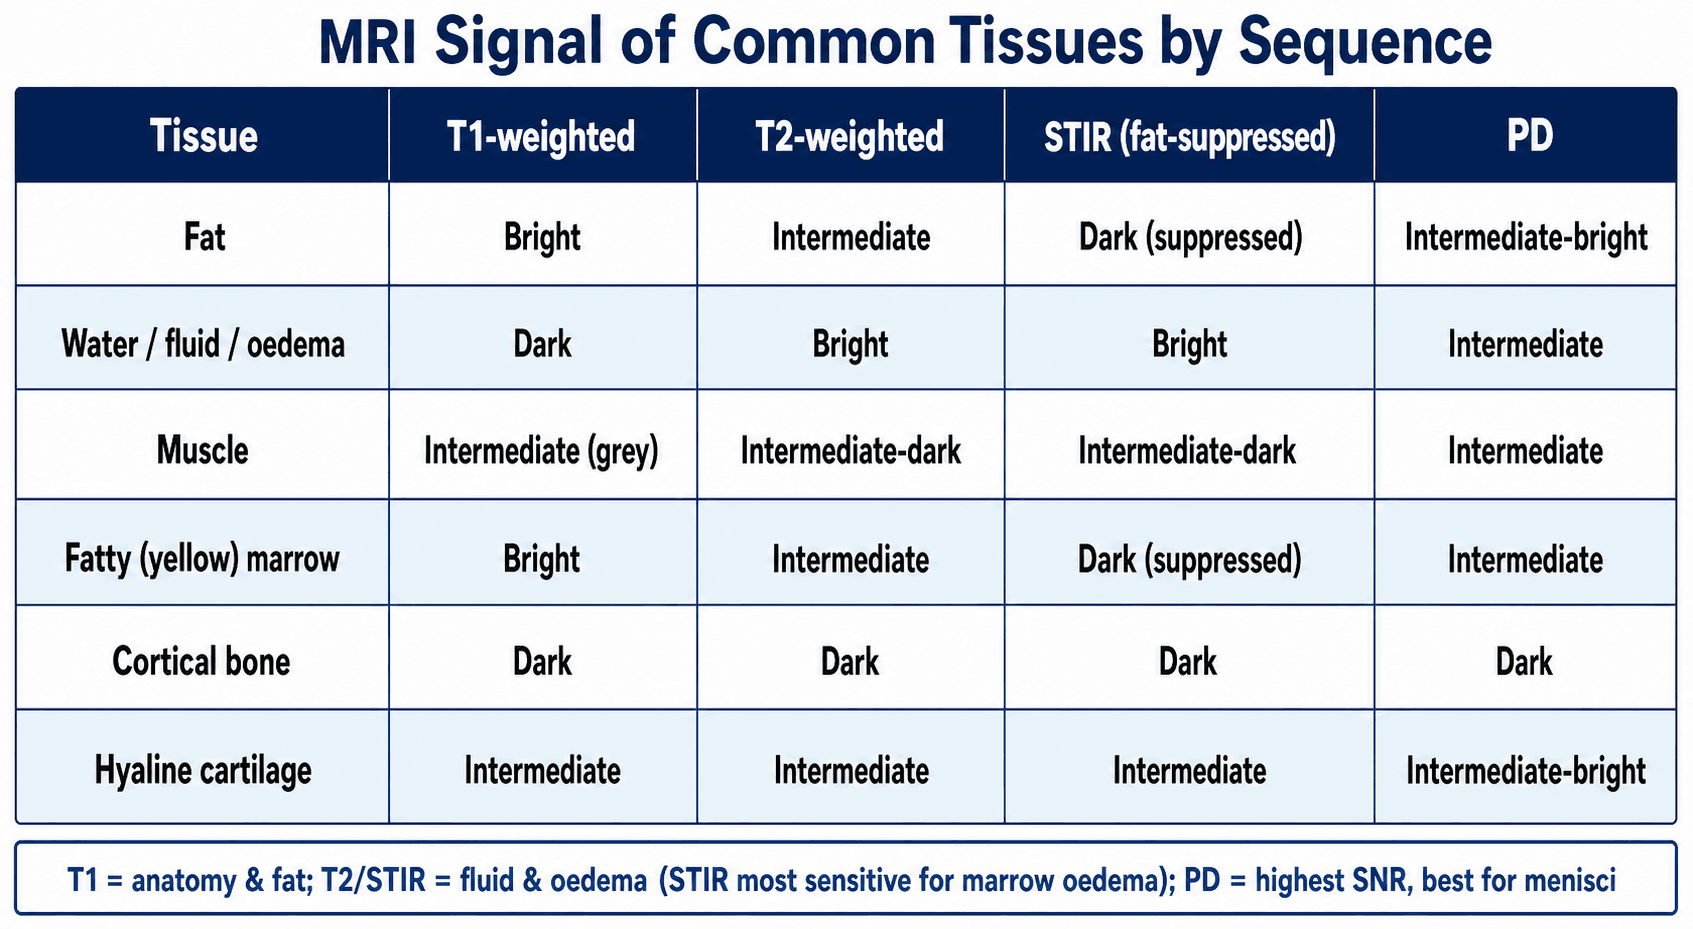
The table below is the reference the four tabs explain: how the common tissues signal on each core sequence.
Parameters. Short TR (400-600ms), short TE (10-20ms).
What it is for. T1 is the anatomical backbone of any MRI examination. It gives excellent contrast between fat (bright), muscle (grey) and fluid (dark), and its consistent appearance makes it the reference sequence for anatomical orientation: the fat planes between structures provide natural contrast boundaries, and cortical margins are seen.
Fat, marrow and blood. Fatty replacement of muscle in a chronic rotator cuff tear appears bright. Normal adult bone marrow is bright on T1 because of its fat content, so loss of that normal brightness, dark marrow, indicates pathology: infiltration, infection, tumour or oedema. Methaemoglobin in subacute blood is also bright on T1.
Gadolinium. T1 is the baseline for gadolinium enhancement: gadolinium shortens T1 and makes enhancing tissue brighter, so T1 post-contrast is the sequence used to detect enhancement.
What T1 misses. Oedema is dark on T1 and may be subtle against dark background structures; early soft-tissue inflammation without fat replacement is not seen; fluid-filled structures blend into the dark background. T1 is essential but never sufficient alone, so always correlate with a fluid-sensitive sequence.
Signal Pattern Differential
Much of MRI interpretation is pattern recognition: a given signal behaviour across sequences narrows the differential. The table distinguishes commonly confused signal patterns and the sequence behaviour that separates them, the equivalent of a differential diagnosis in cross-sectional imaging.
- Differential Possibilities
- Fat, subacute haemorrhage (methaemoglobin), proteinaceous fluid, melanin, gadolinium
- Discriminating Feature
- Apply fat suppression: fat loses signal; methaemoglobin and gadolinium persist. Gadolinium needs prior contrast administration
- Differential Possibilities
- Bone marrow oedema (trauma, stress), infection, tumour infiltration, red marrow reconversion
- Discriminating Feature
- Correlate with T1: true pathology darkens marrow on T1; normal red marrow stays brighter than adjacent muscle/disc
- Differential Possibilities
- Tendinopathy, partial tear, magic angle artefact
- Discriminating Feature
- Repeat on long-TE T2: magic angle artefact DISAPPEARS; true pathology persists
- Differential Possibilities
- Haemosiderin (PVNS, prior bleed), calcification, gas, metal
- Discriminating Feature
- Susceptibility blooming exaggerates on GRE and shrinks on spin echo; clinical context and CT for calcium vs gas
- Differential Possibilities
- Abscess, hypercellular tumour, acute malignant fracture, cholesteatoma
- Discriminating Feature
- Integrate morphology and enhancement: rim-enhancing collection favours abscess; marrow replacement favours tumour
- Differential Possibilities
- Simple cyst, ganglion, myxoid tumour, necrosis
- Discriminating Feature
- Add post-gadolinium T1 FS: simple cysts show no internal enhancement; solid/myxoid tumours enhance
Chemical shift artefact. Fat and water protons resonate at slightly different frequencies, about 3.5 ppm (about 220 Hz at 1.5T), and that difference produces a classic artefact in two forms.
- Type 1 (misregistration): fat and water signals are shifted relative to each other along the frequency-encoding direction, creating a bright band on one side and a dark band on the other at fat-water interfaces, classically at the vertebral endplates and the kidney. It is worse at higher field strength (3T) and is reduced by increasing receiver bandwidth
- Type 2 (India-ink, black-boundary): on opposed-phase gradient echo, fat and water within the same voxel cancel, producing a characteristic black outline around organs and at fat-water interfaces. This is the same in-phase/opposed-phase physics that Dixon exploits constructively
Recognising chemical shift artefact prevents it from being mistaken for a real lesion or endplate change; the bright/dark pairing along the frequency-encode axis is the giveaway.
Guidelines, Registries & Global Practice
MRI is the most rapidly growing imaging modality worldwide, but access varies enormously by resource setting. High-income countries have more than 30-50 MRI units per million population, whereas many low- and middle-income countries have fewer than 1 per million, with concentration in urban tertiary centres. This drives global practice variation: where MRI is scarce, ultrasound and radiographs carry more of the diagnostic load and MRI is reserved for surgical decision-making, whereas in well-resourced systems MRI is often a first-line test.
Side-by-Side Guidance from Major Societies
- Focus
- Evidence-based ordering and protocoling
- Practical Recommendation
- Defines when MRI is 'usually appropriate' by clinical scenario; standardises core sequences and use of arthrography/contrast
- Focus
- Musculoskeletal MRI protocols and reporting
- Practical Recommendation
- Publishes consensus minimum sequence sets per joint and structured reporting templates to reduce inter-centre variation
- Focus
- Justification and access
- Practical Recommendation
- Emphasise clinical justification, ionising-radiation-sparing pathways, and MRI only where it changes management
- Focus
- Minimum acceptable sequences and quality
- Practical Recommendation
- Sets minimum sequence standards for common indications to ensure consistent image quality across centres
- Focus
- Equitable access and safety
- Practical Recommendation
- Promote safe MRI implementation and appropriate utilisation in limited-resource settings
Practice Variation by Resource Setting
- Well-resourced centres: Routine 3T scanning, dedicated cartilage and metal-artefact-reduction protocols (MAVRIC-SL, SEMAC), wide availability of direct MR arthrography for hip and shoulder labral assessment, and increasing use of deep-learning reconstruction to shorten scan times.
- Limited-resource centres: 1.5T or lower-field systems predominate; abbreviated protocols (fewer sequences, fewer planes) are used to maximise throughput; arthrography and advanced quantitative mapping are often unavailable, so ultrasound and clinical examination retain a larger role.
- Universal principle: Regardless of setting, the referring surgeon must specify the clinical question. Effective surgeon-radiologist communication is the single most important determinant of whether the correct sequences are acquired — far more than scanner field strength.
The move to higher field strength (3T) improves SNR and spatial resolution globally but requires protocol optimisation to manage increased susceptibility artefact and specific absorption rate (SAR) constraints.
Advanced Sequences
- Mechanism
- Uses gradient refocusing instead of 180-degree RF pulse; sensitive to magnetic susceptibility
- Primary Orthopaedic Application
- Haemosiderin detection (PVNS shows blooming), cartilage surface assessment (3D GRE), loose bodies, calcification
- Mechanism
- Measures random (Brownian) motion of water molecules; restricted diffusion appears bright
- Primary Orthopaedic Application
- Infection vs tumour differentiation, abscess detection, vertebral body fracture (acute vs chronic), cellularity of tumours
- Mechanism
- Intra-articular injection of dilute gadolinium then T1-weighted imaging
- Primary Orthopaedic Application
- Gold standard for labral tears (hip, shoulder), SLAP lesions, loose bodies, cartilage defects, capsular pathology
- Mechanism
- Serial T1 images during gadolinium bolus injection tracking enhancement curves
- Primary Orthopaedic Application
- Tumour vascularity mapping, distinguishing viable tumour from necrosis, monitoring treatment response
- Mechanism
- Quantitative measurement of T2 values in articular cartilage pixel by pixel
- Primary Orthopaedic Application
- Early cartilage degeneration detection before morphological changes visible on standard sequences
- Mechanism
- Multi-spectral imaging around metallic implants with slice and frequency encoding corrections
- Primary Orthopaedic Application
- Assessment of periprosthetic soft tissues around hip and knee arthroplasty components
- Mechanism
- Acquires in-phase and opposed-phase echoes and recombines them to generate water-only, fat-only, in-phase and opposed-phase images from ONE acquisition
- Primary Orthopaedic Application
- Water-only image = fat-suppressed; opposed-phase detects microscopic/marrow fat; increasingly the standard MSK fat-suppression method (compared with STIR and chemical fat-sat in the STIR tab above)
DWI for the new vertebral fracture. Diffusion-weighted imaging can distinguish an acute benign osteoporotic vertebral fracture from a pathological fracture with malignant infiltration. An acute benign fracture shows high DWI signal in the early phase but increasing ADC values over time, reflecting oedema; a malignant fracture shows persistently restricted diffusion (high DWI, low ADC) because of hypercellularity. The distinction is clinically important when a new vertebral compression fracture is found in an elderly patient with a history of malignancy.
Controversies & Areas of Uncertainty
3T versus 1.5T for routine MSK. 3T doubles SNR and improves resolution, yet meta-analyses of meniscal and ACL accuracy show that field strength has no significant effect on diagnostic accuracy for these established indications. The advantage of 3T is clearer for cartilage mapping, small structures and labral detail, but it brings greater susceptibility artefact near metal and higher SAR, and the cost-benefit of universal 3T for routine joints remains debated.
Routine gadolinium. Concerns over gadolinium deposition (dentate nucleus and globus pallidus with linear agents) and nephrogenic systemic fibrosis have driven a more selective approach. For many marrow and soft-tissue questions STIR and fluid-sensitive sequences answer the question without contrast, as the foot and ankle marrow data show, so contrast is now reserved for tumour, infection and synovitis rather than used routinely.
Quantitative cartilage mapping. T2 and T1rho mapping detect biochemical cartilage change before morphological loss, but the lack of standardised acquisition, scanner-dependent normative values and the absence of validated treatment thresholds keep these techniques largely within research rather than routine clinical practice.
Deep-learning reconstruction and reads. AI reconstruction can shorten acquisition substantially, and DL-assisted reads now match or exceed radiologists for some meniscal tasks. Uncertainty remains over generalisability across scanners, regulatory status, automation bias and medico-legal responsibility, so these tools currently augment rather than replace expert interpretation.
Region-Specific Protocols
The standard knee protocol.
- Sagittal PD fat-suppressed: gold standard for meniscal tears, ACL assessment and the patellar tendon
- Coronal T1: anatomy, medial and lateral compartments, bone stock
- Coronal PD fat-suppressed or T2 fat-suppressed: collateral ligaments, bone marrow oedema
- Axial PD fat-suppressed: patellofemoral joint, patellar tracking, transverse meniscal ligament
- Sagittal T1 (optional): anatomical reference, fatty infiltration
What to read. Assess the ACL, PCL, MCL, LCL, posterolateral corner, medial and lateral menisci, articular cartilage in all compartments, patellar tracking, bone marrow signal and the popliteal fossa. This protocol covers 95% of knee pathology.
Clinical Decision Scenarios
Practise clinical reasoning and management decisions out loud
“You are asked by an examiner: 'You have requested a knee MRI for a 25-year-old footballer with suspected ACL injury. What sequences would you request and why?'”
“An examiner asks you: 'What is the difference between STIR and fat-suppressed T2? When would you use one over the other?'”
“You are asked to explain magic angle artefact and describe a clinical scenario where it could lead to misdiagnosis.”
TR and TE Control
- TR controls T1 contrast: Short TR = T1-weighted (fat bright, water dark)
- TE controls T2 contrast: Long TE = T2-weighted (water bright)
- Long TR + Short TE = PD (highest SNR, gold standard for meniscus)
- STIR: Inversion at TI 160ms (1.5T) nulls fat signal
Best Sequence for
- Meniscal tears: PD fat-suppressed (sagittal) — highest sensitivity. Normal meniscus is uniformly DARK (short T2)
- Meniscal grading: Grade 3 = signal reaching AT LEAST ONE articular surface = tear. Grades 1-2 stay intrasubstance and are degeneration
- Every core sequence is acquired as FAST spin echo — the echo train keeps fat BRIGHT on T2, which is why fat suppression exists
- Bone marrow oedema: STIR — most sensitive, uniform fat suppression
- Rotator cuff: Coronal oblique T2 fat-suppressed
- Tumour/Infection: T1 + gadolinium with fat suppression
- Haemosiderin (PVNS): GRE/T2* — susceptibility blooming artefact
Fat Suppression
- STIR: Uniform suppression, works near metal, CANNOT use with gadolinium
- Chemical fat sat: Higher SNR, faster, but fails near metal
- Post-gadolinium: MUST use chemical fat sat (NOT STIR)
- Near metal: Always choose STIR over chemical fat sat
Magic Angle Artefact
- Occurs at 55 degrees to B0 — tendons appear falsely bright
- Visible on short TE (T1, PD) — DISAPPEARS on T2 (long TE)
- Classic locations: supraspinatus, Achilles, peroneal tendons
- Always confirm tendon pathology on T2 before diagnosing a tear
MR Arthrography
- Gold standard for labral tears (hip and shoulder)
- Sensitivity 87% vs 66% for non-arthrographic MRI
- Dilute gadolinium injected intra-articularly
- T1 fat-suppressed is the key post-arthrography sequence
Evidence Base
Diagnostic Accuracy of MRI for Meniscal and ACL Tears
- Pooled sensitivity and specificity of MRI against arthroscopy were 89% and 88% for medial meniscal tears (19 studies).
- Lateral meniscal tears had lower sensitivity (78%) but high specificity (95%) — lateral tears are easier to call falsely negative.
- ACL tear detection achieved 87% sensitivity and 93% specificity; magnetic field strength (1.5T vs 3T) had no significant effect on accuracy.
Pooled MRI Performance for Medial vs Lateral Meniscal Tears
- Across 17 studies, MRI sensitivity/specificity was 92%/90% for medial meniscal tears and 80%/95% for lateral meniscal tears.
- Area under the SROC curve was 0.97 for medial and 0.96 for lateral tears, confirming high overall discriminative accuracy.
- Negative likelihood ratio was 0.09 for medial tears — a normal medial meniscus on MRI substantially lowers the probability of a tear.
STIR versus Contrast-Enhanced Fat-Suppressed T1 for Foot/Ankle Marrow Lesions
- In 51 patients, STIR and gadolinium-enhanced fat-suppressed T1 spin-echo produced almost identical depiction of foot and ankle bone marrow abnormalities (concordant patterns in 88-98% of zones).
- Final diagnoses agreed in 94% of involved bones, so STIR captured marrow pathology without requiring contrast.
- Contrast-enhanced T1 had higher signal-difference-to-noise ratio (mean 126 vs 95), but this did not translate into a meaningful diagnostic advantage over STIR.
These studies establish PD and STIR as the optimal sequences for their respective indications.