Magnetic Resonance for Orthopaedic Surgeons
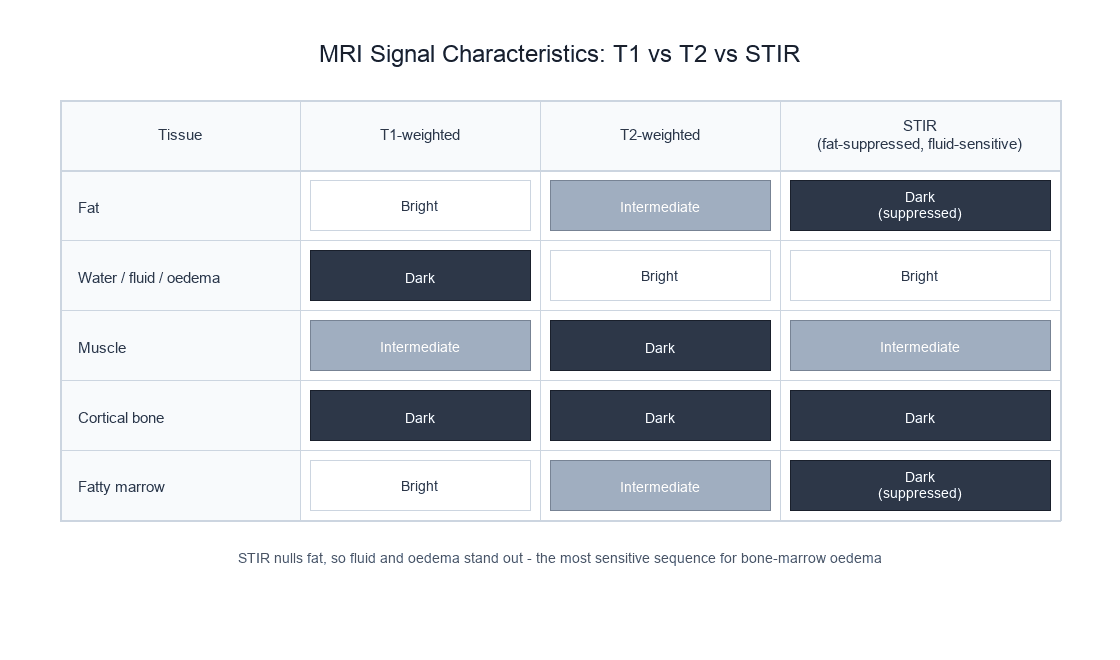
T1-weighted: Fat = bright, Muscle = grey, Water = dark, Bone cortex = dark (no signal)
T2-weighted: Water = bright, Fat = intermediate, Muscle = dark, Bone cortex = dark
STIR: Water/oedema = bright, Fat = suppressed (dark), Pathology highlighted
T1 + Gadolinium: Enhancing tissue = bright (tumour, infection, synovitis)
Key: The appearance of a tissue on MRI depends on the pulse sequence used — the same tissue can appear different on T1 vs T2
- MRI uses strong magnetic fields and radiofrequency pulses — NO ionising radiation. Safe for repeated imaging.
- Signal comes from hydrogen protons (H+) in water and fat, which are abundant in all musculoskeletal tissues.
- T1 relaxation (longitudinal recovery) determines signal differences based on molecular environment: fat is bright, water is dark on T1.
- T2 relaxation (transverse decay) determines signal based on free water content: water is bright, fat is intermediate on T2.
- MRI is the gold standard for soft tissue assessment: ligaments, tendons, cartilage, bone marrow oedema, and infection.
- “T1-weighted: fat = bright white, muscle = grey, water/fluid = dark. Best for anatomy and fat-containing pathology.
- “T2-weighted: water/fluid = bright white, fat = intermediate grey, muscle = dark. Best for pathology detection (oedema, effusion, tears).
- “STIR/fat-suppressed T2: suppresses fat signal to highlight oedema — the most sensitive sequence for bone marrow oedema.
- “Gadolinium shortens T1, making enhancing tissue bright on T1-weighted images — used for tumour, infection, and synovitis assessment.
- “MRI contraindications: cardiac pacemakers (non-MRI-conditional), cochlear implants, ferromagnetic foreign bodies, certain vascular clips.
MRI physics is a high-yield examination topic. You must be able to explain: the origin of the MRI signal (hydrogen protons), T1 vs T2 relaxation, why fat is bright on T1, why water is bright on T2, the role of gadolinium, indications vs contraindications, and the advantages of MRI over CT for soft tissue assessment. You will frequently be asked to interpret MRI sequences and explain why you would choose specific sequences for specific clinical questions.
SCRAMMRI Advantages Over CT
Hook:SCRAM to the MRI scanner when you need soft tissue answers that CT and X-ray cannot provide.
Overview
Magnetic resonance imaging (MRI) is the gold standard imaging modality for soft tissue assessment in orthopaedic practice. Unlike plain radiography and CT, which rely on ionising radiation and differential X-ray absorption, MRI uses strong magnetic fields and radiofrequency (RF) pulses to generate images based on the behaviour of hydrogen protons within tissue. This produces unparalleled soft tissue contrast without any radiation exposure.
MRI is the modality of choice for evaluating ligament and tendon injuries, meniscal tears, articular cartilage defects, bone marrow oedema (occult fractures, stress reactions, avascular necrosis), soft tissue tumours, and infection. Its multiplanar capability and lack of ionising radiation make it particularly valuable in paediatric imaging and serial monitoring.
The principal limitations of MRI are: long acquisition times (20-45 minutes), claustrophobia, contraindications in patients with certain implants, significant metal artefact from orthopaedic hardware, high cost, and inferior spatial resolution for cortical bone compared to CT.
Ligament and tendon injuries (ACL, rotator cuff, Achilles). Meniscal pathology. Articular cartilage assessment. Bone marrow oedema (occult fractures, stress injuries, AVN). Soft tissue and bone tumour characterisation. Infection (osteomyelitis, septic arthritis). Spinal cord and nerve root assessment. Paediatric musculoskeletal conditions.
Complex fracture characterisation (acetabulum, tibial plateau, calcaneus). Cortical bone detail and fracture lines. Preoperative 3D planning. Lung metastasis screening. Calcification patterns (tumour matrix, CPPD). Patients with MRI contraindications. Acute trauma where speed is critical.
Systematic Approach
Systematic MRI Interpretation Framework
A structured approach to MRI interpretation ensures comprehensive assessment and prevents missed pathology. Apply this checklist to every orthopaedic MRI:
- What to Assess
- Confirm which sequences are present: T1, T2, PD, STIR, post-gadolinium
- Key Considerations
- Each sequence provides different information — you cannot interpret pathology from a single sequence alone
- What to Assess
- Use T1-weighted images as the anatomical reference: identify all structures
- Key Considerations
- Fat is bright, providing natural contrast. Excellent for cortical bone margins, fatty marrow, and anatomical orientation
- What to Assess
- Scan fluid-sensitive sequences for oedema, effusion, and soft tissue injury
- Key Considerations
- Bright signal on STIR/fat-suppressed T2 indicates pathology: oedema, tears, inflammation, fluid
- What to Assess
- Cross-reference findings on both sequences to characterise the underlying tissue
- Key Considerations
- Bright on T1 and T2 = fat or subacute blood. Dark on T1 and bright on T2 = water/oedema. Dark on both = cortex, fibrous tissue, calcification, haemosiderin
- What to Assess
- Review axial, sagittal, and coronal images systematically
- Key Considerations
- Certain pathology is best seen in specific planes (e.g., meniscal tears on sagittal, ACL on sagittal)
- What to Assess
- Do not forget periarticular structures: bursae, nerves, muscles, vessels
- Key Considerations
- Common exam trap: focusing on the joint while missing a nerve sheath tumour, muscle denervation oedema, or Baker cyst
MRI Physics Fundamentals
The MRI Signal Source
MRI signal originates from hydrogen protons (H+), which are the most abundant MRI-visible nuclei in the body due to the ubiquity of water (H2O) and fat (CH2) in tissues. Each hydrogen proton possesses a quantum property called spin angular momentum, which gives it a small magnetic moment — essentially making each proton a tiny bar magnet.
In the absence of an external magnetic field, proton magnetic moments are randomly oriented and cancel each other out. When the patient enters the MRI scanner, the strong external magnetic field (B0, typically 1.5 or 3 Tesla) causes the protons to align either parallel (low energy, slight majority) or anti-parallel (high energy) to the field. The small excess of parallel protons creates a net magnetisation vector that provides the measurable MRI signal.
Precession and the Larmor Equation
Within the magnetic field, protons do not simply align — they precess (wobble) around the direction of B0, much like a spinning top wobbles around the gravitational axis. The frequency of precession is determined by the Larmor equation:
ω = γ × B0
Where ω is the precessional (Larmor) frequency, γ is the gyromagnetic ratio (42.58 MHz/T for hydrogen), and B0 is the external magnetic field strength. At 1.5T, protons precess at approximately 63.87 MHz; at 3T, approximately 127.74 MHz. This frequency determines the radiofrequency pulse needed to excite the protons.
Excitation and Relaxation
T1 Relaxation (Longitudinal Recovery)
After a radiofrequency (RF) pulse tilts the net magnetisation vector away from the B0 axis, the protons gradually recover their longitudinal magnetisation along B0. This process is called T1 relaxation (also called spin-lattice relaxation because the protons release energy to the surrounding molecular lattice).
T1 is the time constant for 63% recovery of the longitudinal magnetisation.
The rate of T1 recovery depends on how efficiently protons can transfer their excess energy to the surrounding molecular lattice. This is most efficient when molecular tumbling frequencies match the Larmor frequency:
- Fat has SHORT T1 (approximately 250ms at 1.5T): Fat molecules tumble at frequencies close to the Larmor frequency, enabling rapid energy transfer. Fat therefore recovers signal quickly and appears bright on T1-weighted images.
- Water has LONG T1 (approximately 2500ms at 1.5T): Small, rapidly tumbling water molecules are inefficient at energy transfer. Water recovers slowly and appears dark on T1-weighted images.
- Muscle has INTERMEDIATE T1: Between fat and water. Appears grey on T1.
T1-weighted images provide excellent anatomical detail because fat provides natural high-contrast boundaries between structures.
TR and TE: The Parameters That Control Image Weighting
T1 and T2 are intrinsic tissue properties - you cannot change them. What the operator controls are two timing parameters that decide how much T1 or T2 contrast appears in the final image: the repetition time (TR) and the echo time (TE).
- TR (repetition time) is the time between successive RF excitation pulses. It governs how much T1 (longitudinal) recovery is allowed before the next pulse, so TR controls T1 weighting. A short TR exaggerates differences in T1 recovery (fat has recovered, water has not) - maximising T1 contrast. A long TR lets nearly all tissues recover fully, erasing T1 differences.
- TE (echo time) is the interval between the RF pulse and sampling of the echo. It governs how much T2 (transverse) decay has occurred before the signal is read, so TE controls T2 weighting. A long TE lets short-T2 tissues decay away while long-T2 water still gives signal - maximising T2 contrast. A short TE samples before much decay, erasing T2 differences.
- TR
- Short (~400-700 ms)
- TE
- Short (~10-20 ms)
- Contrast source
- Differences in T1 recovery (fat bright, water dark)
- TR
- Long (~2000-4000 ms)
- TE
- Long (~80-120 ms)
- Contrast source
- Differences in T2 decay (water bright)
- TR
- Long (~2000-4000 ms)
- TE
- Short (~10-20 ms)
- Contrast source
- Minimises both T1 and T2 effects - contrast reflects proton (water) density
- TR
- Long, with inversion pulse
- TE
- Long, TI ~150-170 ms at 1.5T
- Contrast source
- Inversion time chosen to null fat; fluid-sensitive and fat-suppressed
"Short TR = T1, long TE = T2." If you remember only one thing about sequence weighting, remember that TR drives T1 contrast and TE drives T2 contrast. Proton-density images deliberately use a long TR and a short TE so that neither relaxation dominates and the signal mainly reflects how many protons are present - which is why PD is the workhorse for menisci and cartilage.
Spatial Encoding: Turning Signal into an Image
Relaxation explains contrast, but a separate set of principles explains how the scanner knows where each signal came from. This is achieved with three orthogonal gradient coils that superimpose a small, linear, position-dependent variation onto the main B0 field, so that precessional (Larmor) frequency now varies with position.
- Slice selection: a gradient is applied during the RF pulse so that only the slice whose Larmor frequency matches the RF bandwidth is excited. Gradient steepness and RF bandwidth set slice thickness and position.
- Frequency encoding (readout): a gradient applied during signal sampling makes precession frequency vary along one in-plane axis, so position along that axis is encoded as signal frequency.
- Phase encoding: a brief gradient applied before readout imparts a position-dependent phase shift along the perpendicular axis; the sequence is repeated many times with stepped phase-encode strengths to build up the second spatial dimension.
The acquired data fill a matrix called k-space (the spatial-frequency domain); a two-dimensional inverse Fourier transform of k-space reconstructs the anatomical image. The centre of k-space carries image contrast (low spatial frequencies, overall signal), while the periphery carries fine detail and edges (high spatial frequencies) - a fact that underpins fast-imaging and artefact behaviour.
Spatial encoding explains the direction of common artefacts: motion and pulsation artefacts propagate along the phase-encode direction (each phase step is a separate acquisition, so movement between steps smears that axis), while chemical-shift misregistration occurs along the frequency-encode direction. Knowing which gradient does what lets you swap phase and frequency directions to move an artefact away from the area of interest.
Key MRI Sequences
- Signal Characteristics
- Fat = bright, Muscle = grey, Water = dark, Cortex = dark
- Best For
- Anatomical detail, fatty infiltration, subacute haemorrhage, post-gadolinium enhancement
- Signal Characteristics
- Water = bright, Fat = intermediate, Muscle = dark, Cortex = dark
- Best For
- Pathology detection: effusions, oedema, meniscal tears, ligament injuries
- Signal Characteristics
- Between T1 and T2; intermediate contrast
- Best For
- Meniscal tears (gold standard), cartilage assessment, ligament detail
- Signal Characteristics
- Fat signal suppressed; water/oedema = very bright
- Best For
- Bone marrow oedema (most sensitive), occult fractures, stress reactions, tumour spread
- Signal Characteristics
- Similar to STIR but uses chemical fat saturation instead of inversion
- Best For
- Bone marrow oedema, ligament tears, tendon pathology — less uniform fat suppression than STIR at field boundaries
- Signal Characteristics
- Enhancing tissue = bright on T1; non-enhancing = dark
- Best For
- Tumour vascularity, infection (abscess rim), active synovitis, post-operative assessment
- Signal Characteristics
- Susceptibility sensitive; blooming of haemosiderin and calcification
- Best For
- Haemosiderin (PVNS), calcification, cartilage surface (T2*-weighted GRE)
Both STIR and fat-suppressed T2 highlight oedema by removing the fat signal, but they work differently. STIR uses an inversion pulse to null fat signal and provides UNIFORM fat suppression across the entire field of view — making it more reliable at field boundaries and around metal. Fat-suppressed T2 uses chemical fat saturation, which is faster but LESS UNIFORM near metal and at the edges of the field. For bone marrow oedema detection, STIR is generally preferred as the more sensitive and robust sequence.
Gadolinium Contrast
Gadolinium-based contrast agents (GBCAs) are paramagnetic substances that shorten T1 relaxation time, causing enhancing tissues to appear bright on T1-weighted post-contrast images. Gadolinium is administered intravenously and distributes through the vascular compartment and into the interstitium of tissues with disrupted capillary barriers.
Orthopaedic Indications for Gadolinium
- What Enhancement Shows
- Viable tumour enhances; necrotic/cystic areas do not
- Clinical Value
- Distinguishes solid from cystic components; guides biopsy site; monitors treatment response
- What Enhancement Shows
- Abscess shows rim enhancement; phlegmon enhances diffusely
- Clinical Value
- Distinguishes drainable abscess from phlegmon; identifies extent of infection
- What Enhancement Shows
- Active enhancing synovium (thickened, vascular)
- Clinical Value
- Distinguishes active inflammatory synovitis from chronic effusion in rheumatoid arthritis
- What Enhancement Shows
- Enhancement pattern around implants; recurrent vs scar tissue
- Clinical Value
- Recurrent tumour enhances; post-surgical scar shows progressive enhancement pattern
- What Enhancement Shows
- Dilute intra-articular gadolinium outlines labrum, cartilage, ligaments
- Clinical Value
- Gold standard for labral tears (hip and shoulder), SLAP lesions, and loose body detection
Nephrogenic Systemic Fibrosis (NSF): Gadolinium-based contrast agents can cause NSF in patients with severe renal impairment (eGFR below 30 mL/min/1.73m²). NSF is a serious, potentially fatal fibrosing condition affecting the skin, joints, and internal organs. Group II GBCAs (macrocyclic agents: gadobutrol, gadoterate, gadoteridol) are considered safer and preferred. Always check renal function (eGFR) before administering gadolinium. NSF risk with macrocyclic agents is considered negligible.
TISGadolinium Enhancement
Hook:TIS: gadolinium lights up Tumour, Infection, and Synovitis — the three main indications for contrast MRI in orthopaedics.
MRI Artefacts
- Cause
- Ferromagnetic and paramagnetic implants distort the local magnetic field
- Appearance
- Signal void with surrounding signal pile-up (blooming); geometric distortion
- Reduction Strategies
- Metal artefact reduction sequences (MAVRIC-SL, SEMAC); wider bandwidth; spin echo over gradient echo; lower field strength
- Cause
- Fat and water protons precess at slightly different frequencies
- Appearance
- Bright/dark bands at fat-water interfaces in the frequency-encoding direction
- Reduction Strategies
- Wider receiver bandwidth; fat suppression sequences; swap phase/frequency directions
- Cause
- Patient movement during the long acquisition
- Appearance
- Ghosting (periodic repeating copies) in the phase-encoding direction
- Reduction Strategies
- Motion correction algorithms, breath-holding (not applicable for extremities), faster sequences, patient education
- Cause
- Structures oriented at 55 degrees to B0 exhibit artificially increased signal
- Appearance
- Tendon or ligament appears abnormally bright, simulating pathology
- Reduction Strategies
- Confirm on T2: magic angle should NOT be bright on T2. Reposition if possible
- Cause
- Incomplete sampling of sharp signal transitions
- Appearance
- Alternating bright and dark lines parallel to high-contrast interfaces
- Reduction Strategies
- Increase matrix size; occurs at spinal cord-CSF boundary simulating syrinx
The magic angle effect is a common source of false positive MRI findings. When a tendon (Achilles, supraspinatus, patellar) or ligament is oriented at approximately 55 degrees to the main magnetic field (B0), the normally dark structure appears bright on short TE sequences (T1, PD), mimicking tendinopathy or a tear. The key to avoiding misdiagnosis is: (1) the abnormal signal should NOT persist on T2-weighted images with long TE, and (2) clinical correlation is essential. This is a frequently examined topic.
Signal Differential: Reasoning from T1/T2 Behaviour
A common viva task is to be shown a lesion described by its T1 and T2 signal and asked to generate a differential. Reasoning from the two-by-two of signal behaviour is more reliable than memorising lists, because each combination reflects a tissue property (fat, free water, fibrous/calcified tissue, blood-product stage, or paramagnetic material).
- Underlying Property
- Fat or fat-containing tissue
- Typical Differentials
- Normal fatty marrow, lipoma, intraosseous lipoma, well-differentiated liposarcoma component, subacute haematoma (methaemoglobin)
- Underlying Property
- Free water / oedema
- Typical Differentials
- Joint effusion, cyst, abscess, bone marrow oedema, acute tumour-associated oedema, soft tissue oedema, simple ganglion
- Underlying Property
- Low mobile-proton or paramagnetic content
- Typical Differentials
- Cortical bone, calcification, mature fibrous tissue/scar, haemosiderin (PVNS, chronic haematoma), gas, dense sclerosis, flow void
- Underlying Property
- Paramagnetic or proteinaceous material
- Typical Differentials
- Melanin (melanoma metastasis), proteinaceous/haemorrhagic cyst, subacute clot in specific phases, high-protein collection
- Underlying Property
- Vascularised/enhancing tissue
- Typical Differentials
- Viable tumour, active synovitis, abscess rim, granulation tissue, recurrent tumour (vs non-enhancing scar)
Loss of the normal bright fatty marrow signal on T1 is one of the most reliable signs of marrow-replacing pathology (tumour, infection, infiltration). A common error is to rely on STIR or fluid-sensitive sequences alone — these are sensitive but non-specific. The combination of low T1 (marrow replacement) plus high STIR is far more concerning than high STIR with preserved T1 (which often reflects benign oedema). Always anchor marrow assessment on the T1 sequence.
WW-FFMRI Signal Appearance
Hook:Water White T2, Water Washed-out T1, Fat Flashy T1, Fat Faded T2 — the four rules that unlock MRI interpretation.
Guidelines, Registries & Global Practice
Global Epidemiology of MRI Utilisation
MRI use has grown steadily worldwide and varies enormously by health-system resourcing. OECD data show MRI examinations ranging from over 140 per 1,000 population per year in the highest-utilising systems (e.g. Germany, United States, France) to a small fraction of that in many low- and middle-income countries, where scanner density may be fewer than one unit per million population. Musculoskeletal indications (knee, spine, shoulder) consistently rank among the most common reasons for outpatient MRI in high-income systems, and concerns about over-utilisation of knee and lumbar spine MRI have driven multiple "choosing wisely" type initiatives.
Side-by-Side Guideline Comparison
- Domain
- Appropriateness & contrast safety
- Key Position
- Appropriateness Criteria for MSK indications; Manual on Contrast Media stratifies gadolinium agents into Group I/II/III and recommends Group II macrocyclic agents for at-risk patients
- Domain
- MR safety zones
- Key Position
- Four-zone access control, designated MR Safety Officer/Medical Director, and labelling terminology (MR-safe, MR-conditional, MR-unsafe)
- Domain
- Requesting & reporting
- Key Position
- iRefer referral guidance promotes appropriate use; emphasises clinical correlation to avoid over-investigation of incidental findings
- Domain
- Protocols & arthrography
- Key Position
- European Society of Musculoskeletal Radiology protocol recommendations standardise joint-specific sequences and MR arthrography technique
- Domain
- Linear gadolinium agents
- Key Position
- EMA suspended most linear GBCAs for general use; FDA retained them with class warnings on gadolinium retention — a genuine regulatory divergence
- Domain
- Hardware imaging
- Key Position
- Device-specific MR-conditional labelling (field strength, SAR, gradient limits) governs whether and how implanted patients can be scanned
Practice Variation: High- vs Limited-Resource Settings
- High-resource settings: ready access to 1.5T and 3T, dedicated MSK coils, metal-artefact reduction sequences (MAVRIC-SL, SEMAC), and outpatient MR arthrography. The challenge is appropriate use and managing incidental findings, not access.
- Limited-resource settings: scanners may be few, geographically concentrated, and predominantly low-field (0.2-0.5T) or older 1.5T units. Ultrasound and plain radiography carry more diagnostic load, and MRI is reserved for cases that will change management (tumour, infection, surgical planning). Point-of-care and emerging low-field portable MRI (around 0.06T) may improve access in future.
- Regulatory divergence: the EMA-FDA split on linear gadolinium agents means the agents available to a clinician depend on jurisdiction; macrocyclic agents are the global default where choice exists.
MRI itself has no registry in the way arthroplasty does. The relevant "registry-level" evidence is implant MR-conditional labelling and pharmacovigilance reporting of gadolinium-associated NSF and retention.
Controversies & Areas of Uncertainty
Gadolinium deposition in brain (notably dentate nucleus and globus pallidus), bone, and skin is documented even with macrocyclic agents, with greater deposition from linear agents. No definite clinical syndrome has been proven, but uncertainty drove the EMA to suspend most linear agents while the FDA retained them with warnings. The pragmatic position: use macrocyclic agents, give contrast only when it changes management, and use the lowest effective dose.
3T offers higher signal-to-noise and resolution but increases susceptibility artefact (worse around metal), chemical shift, and specific absorption rate. For most native-joint MSK imaging 3T is advantageous; for imaging around implants 1.5T (or dedicated metal-artefact sequences) is generally preferred. Field strength choice is therefore indication-specific, not universally "higher is better".
Direct MR arthrography remains the reference for labral and SLAP lesions, but improving 3T conventional and indirect arthrographic techniques narrow the gap. The trade-off is invasiveness and a small infection/reaction risk against incremental sensitivity. Practice varies widely between centres and countries.
The high sensitivity of MRI is a double-edged sword: degenerative meniscal and labral signal, disc bulges, and marrow oedema are frequently found in asymptomatic individuals. Imaging without a clear clinical question risks over-diagnosis and inappropriate surgery — clinical correlation is mandatory, a recurring examiner theme.

Clinical Decision Scenarios
Practise clinical reasoning and management decisions out loud
“An examiner asks you to explain why fat appears bright on T1-weighted MRI images.”
“A 35-year-old runner presents with medial tibial pain. Plain radiographs are normal. You request an MRI.”
“You request a knee MRI for a patient with a previous knee arthroplasty and new onset pain. The MRI shows significant metal artefact.”
Signal Basics
- Signal source: hydrogen protons (H+) in water and fat
- Larmor equation: frequency = 42.58 MHz/T x field strength
- No ionising radiation — safe for children, pregnant patients, serial monitoring
- 1.5T and 3T are standard clinical field strengths
T1 vs T2 Signal
- T1: Fat = bright, Water = dark, Muscle = grey
- T2: Water = bright, Fat = intermediate, Muscle = dark
- STIR: Water/oedema = bright, Fat = suppressed (most sensitive for marrow oedema)
- Cortical bone = dark signal void on ALL sequences
Key Sequences
- T1 = anatomy and fat; T2/STIR = pathology and oedema
- Proton Density = gold standard for meniscal tears
- T1 + Gadolinium = tumour, infection, synovitis (TIS)
- GRE = haemosiderin (PVNS) and cartilage surface
Gadolinium Safety
- NSF risk with severe renal impairment (eGFR less than 30)
- Group II macrocyclic agents (gadobutrol, gadoterate) are safest
- Always check eGFR before gadolinium administration
- Brain deposition reported — clinical significance uncertain
Metal and MRI
- Use spin echo over gradient echo near metal
- 1.5T produces less artefact than 3T
- MAVRIC-SL and SEMAC are dedicated metal artefact reduction sequences
- STIR provides more uniform fat suppression near metal than chemical fat saturation
Evidence Base
MRI of the Musculoskeletal System
- Comprehensive reference for MRI protocol selection and image interpretation in orthopaedic practice.
- Details the optimal sequences for each anatomical region including shoulder, knee, hip, spine, and extremities.
- Provides systematic interpretation frameworks with pathological correlations validated against surgical and arthroscopic findings.
MRI versus Arthroscopy for Knee Internal Derangement
- Systematic review (Coleman methodology) taking arthroscopy as the reference standard for meniscal and cruciate pathology.
- MRI is highly accurate for diagnosing meniscal and ACL tears and is the most appropriate screening tool before therapeutic arthroscopy.
- Diagnostic performance varies by structure (medial vs lateral meniscus vs ACL), with pooled accuracy around 85%.
MRI for Osteomyelitis Underlying Diabetic Foot Ulcers
- Pooled MRI sensitivity 0.90 and specificity 0.79 for osteomyelitis beneath diabetic foot ulcers.
- MRI was the most accurate imaging test, outperforming plain radiography (sensitivity 0.54), bone scan, and leukocyte scan.
- A positive probe-to-bone test (sensitivity 0.60, specificity 0.91) is moderately predictive and complements MRI.
MRI Detection of Avascular Necrosis of the Femoral Head
- Landmark MR-CT correlation establishing MRI as a sensitive method for early diagnosis of femoral head AVN.
- A peripheral low-signal margin on MRI corresponded to the sclerotic rim seen on CT in 95% of lesions (the substrate of the classic double-line sign).
- CT depicted subchondral fractures more clearly than MRI, remaining valuable for staging collapse.
Clinical MRI evidence supports its role as the primary soft tissue imaging modality.