Understanding Normal and Pathological Marrow
Normal yellow marrow: T1 bright, T2 intermediate, STIR suppressed
Red marrow: T1 slightly less bright than fat, T2 intermediate
Oedema: T1 dark, STIR bright
Fatty replacement: T1 bright, STIR suppressed
Fibrosis/sclerosis: T1 dark, T2 dark, STIR dark
Tumour infiltration: T1 dark, T2 bright or intermediate, STIR bright
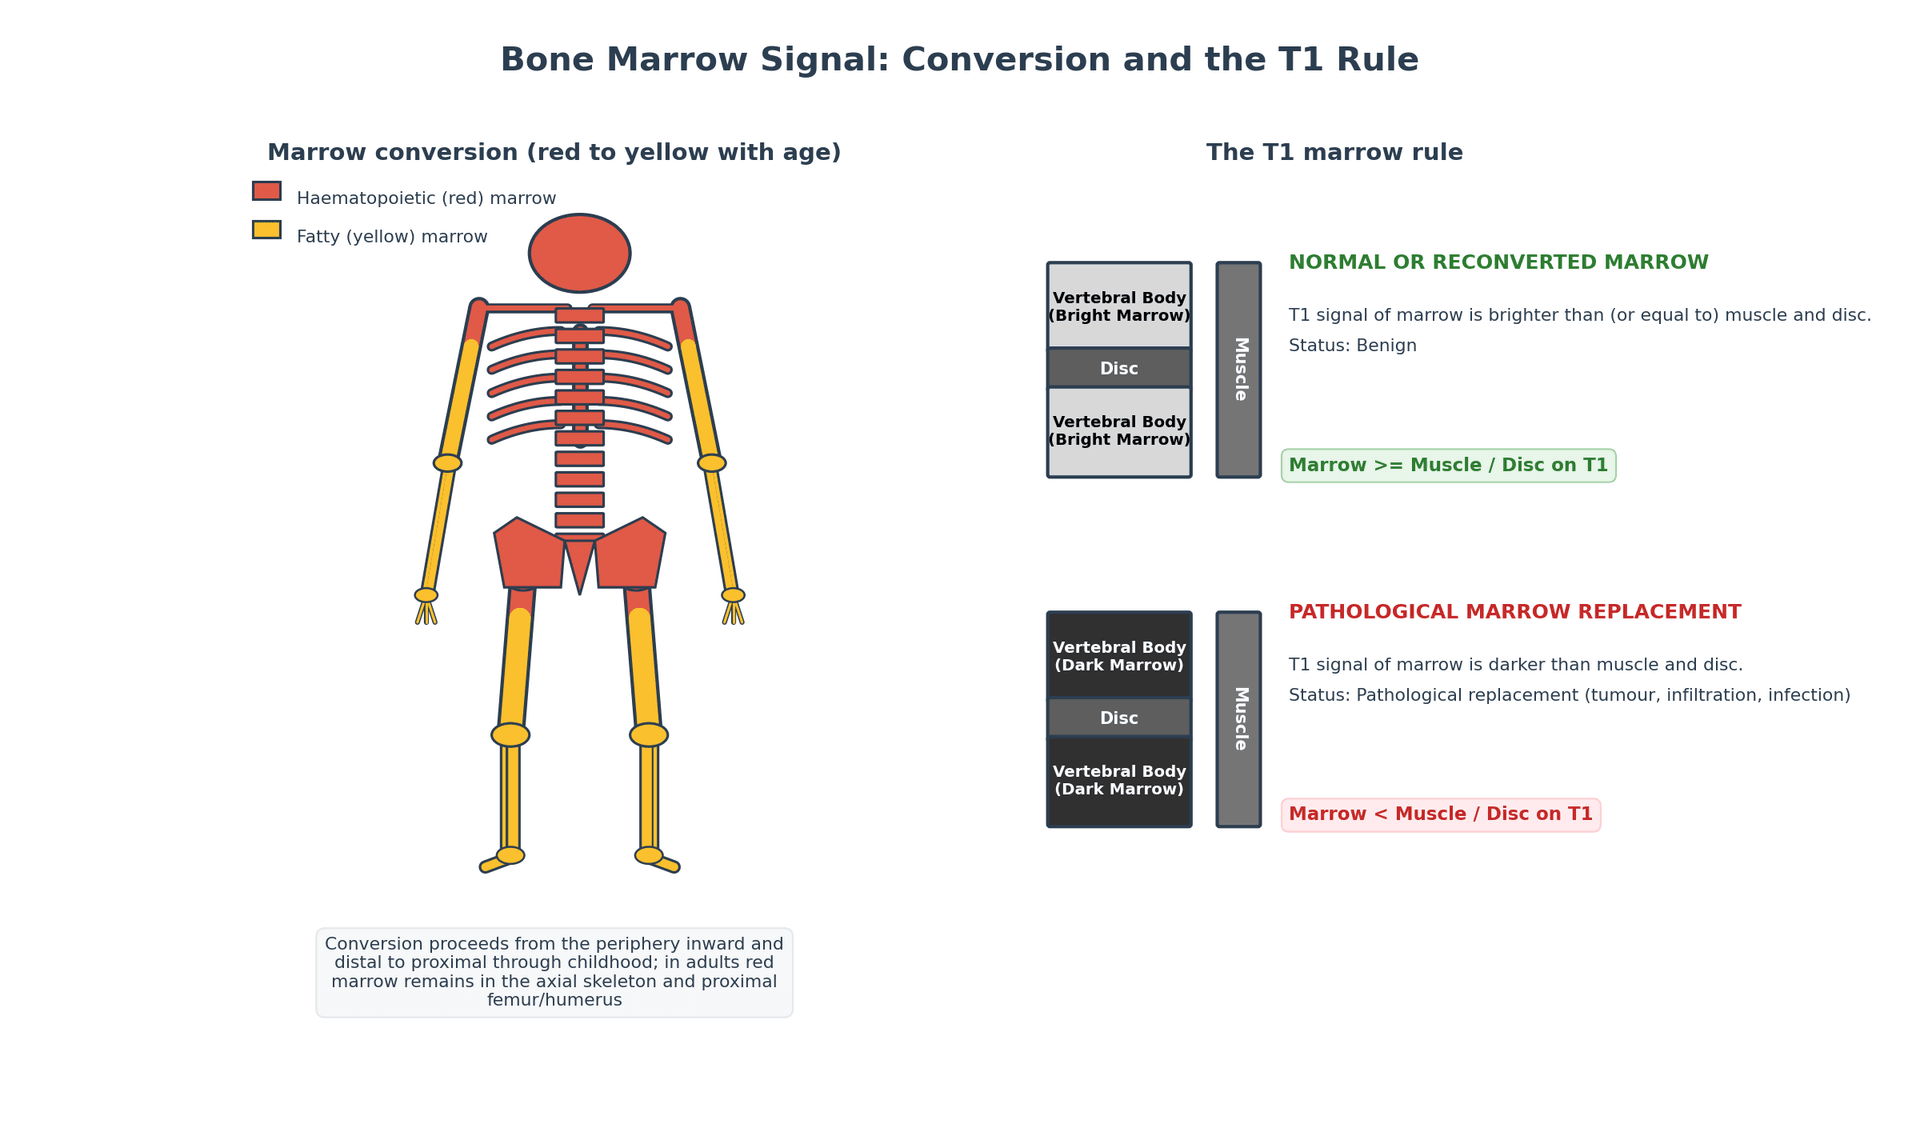
Key: The first step in marrow assessment: Is the T1 signal brighter or darker than muscle?
- Normal adult bone marrow is predominantly yellow (fatty) and appears BRIGHT on T1: loss of T1 brightness is the cardinal sign of marrow pathology.
- Marrow conversion: red (haematopoietic) marrow converts to yellow (fatty) marrow from distal to proximal and from diaphysis to metaphysis during childhood.
- STIR is the most sensitive sequence for detecting bone marrow oedema from any cause: fracture, infection, tumour, AVN.
- The 'double line sign' on T2 — a band of high signal surrounded by a low-signal rim — is pathognomonic for avascular necrosis.
- Modic changes classify vertebral endplate marrow signal: Type 1 (oedema), Type 2 (fatty), Type 3 (sclerotic).
- “On T1-weighted images, normal bone marrow is brighter than muscle. If marrow is DARKER than muscle on T1, it is abnormal.
- “Red marrow reconversion (physiological) can mimic pathological infiltration — look for symmetric distribution and residual fat signal.
- “Stress fractures show marrow oedema (bright STIR) BEFORE a fracture line becomes visible on plain radiographs or CT.
- “Transient osteoporosis of the hip: diffuse femoral head marrow oedema on STIR with no double line sign (distinguishes from AVN).
- “Tumour infiltration typically replaces the normal T1 bright marrow with dark signal and enhances with gadolinium.
Bone marrow signal interpretation is a core MRI skill tested in fellowship examinations. You must be able to: explain normal marrow conversion, identify the T1 signal as the cornerstone of marrow assessment, differentiate oedema from infiltration from red marrow reconversion, identify the double line sign of AVN, and classify Modic changes. A common viva trap is failing to use the T1 signal as the primary reference when assessing marrow pathology — many candidates focus only on STIR, which is sensitive but not specific.
FBMNormal Marrow on T1
Hook:FBM: Fat Bright Marrow on T1. If marrow is darker than muscle on T1, something is wrong.
Overview
Bone marrow signal on MRI is one of the most clinically important imaging findings in orthopaedic practice. The ability to detect changes in marrow signal allows early diagnosis of occult fractures, stress injuries, avascular necrosis, infection, and tumour infiltration — often weeks or months before these conditions become visible on plain radiographs or CT.
The foundation of marrow assessment on MRI is the T1-weighted signal. Normal adult bone marrow is predominantly yellow (fatty) marrow, which appears bright on T1-weighted images due to the short T1 of fat. Any process that replaces, displaces, or alters this fatty marrow will reduce the T1 signal, making the abnormal area darker than the surrounding normal marrow. This simple observation — is the marrow bright or dark on T1? — is the single most important assessment in musculoskeletal MRI.
At birth, the entire skeleton contains red (haematopoietic) marrow. During childhood and adolescence, red marrow progressively converts to yellow (fatty) marrow in a predictable pattern: from distal to proximal (feet and hands first, axial skeleton last) and within long bones from diaphysis to metaphysis. By approximately age 25, the distribution reaches the adult pattern with red marrow confined to the axial skeleton, proximal femora, proximal humeri, and some metaphyseal regions. Yellow marrow is T1 bright; red marrow is less bright but still usually brighter than muscle.
Abnormal bone marrow signal suggests a pathological process. Key patterns: (1) Oedema = T1 dark, STIR bright (fracture, infection, tumour, reactive). (2) Infiltration = T1 dark, may enhance with gadolinium (tumour, leukaemia, lymphoma). (3) Fatty replacement = T1 bright, STIR suppressed (chronic change, healed process). (4) Fibrosis/sclerosis = dark on T1 AND T2 (low signal on all sequences — Paget disease, chronic osteomyelitis, radiation therapy). (5) Red marrow reconversion = slightly dark on T1, often symmetric and in expected locations (physiological response to anaemia, chronic illness, smoking).
Pathological Marrow Patterns
AVN (Osteonecrosis)
MRI is the most sensitive and specific imaging modality for detecting avascular necrosis, identifying signal changes months to years before plain radiographic changes appear.
T1 findings: The necrotic zone shows loss of normal bright T1 fatty marrow signal. A band of low T1 signal (the reactive interface between viable and necrotic bone) is characteristic.
T2 findings: The 'double line sign' is pathognomonic for AVN — a band of bright signal (fluid/granulation tissue) bordered by a low-signal rim (sclerotic reactive bone) at the necrotic interface. The double line sign has a specificity of nearly 100% for AVN.
STIR findings: The reactive zone and surrounding oedema are bright on STIR. The extent and pattern of STIR signal help with prognostication.
Femoral head AVN staging (MRI):
- Stage I: Normal radiograph, abnormal MRI (marrow oedema or subtle signal change)
- Stage II: Sclerosis on radiograph, characteristic MRI changes without collapse
- Stage III: Subchondral fracture (crescent sign) — MRI shows subchondral high signal on T2
- Stage IV: Femoral head collapse and secondary osteoarthritis
Key differential: transient osteoporosis of the hip shows diffuse marrow oedema of the entire femoral head WITHOUT the double line sign and WITHOUT a serpentine demarcation line. This distinction is critical because transient osteoporosis is self-limiting while AVN may require surgical intervention.
The Association Research Circulation Osseous (ARCO) system — the modern internationally-used staging referenced in EFORT/European guidance and revised in 2019 — maps directly onto these MRI findings. Stage 0: all imaging normal, lesion only suspected (silent hip). Stage I: radiographs and CT normal but MRI (or bone scan) positive — the marrow signal change / double-line is the only abnormality. Stage II: radiographic changes (sclerosis, osteopenia, cysts) WITHOUT subchondral fracture or head flattening. Stage III: subchondral fracture (crescent sign) and/or head flattening with a preserved joint space — subdivided IIIA (early, depression 2 mm or less) and IIIB (advanced, depression over 2 mm). Stage IV: secondary osteoarthritis with joint-space narrowing and acetabular change. The pivotal prognostic boundary is Stage III (subchondral collapse): pre-collapse lesions (0-II) are candidates for joint-preserving surgery, while post-collapse lesions (III-IV) usually require arthroplasty. ARCO also grades lesion size and the proportion of the weight-bearing surface involved, which independently predicts collapse.
FISTSCauses of Bone Marrow Oedema
Hook:FISTS cause marrow oedema: Fracture, Infection, Surgery, Tumour, Stress/Transient.
Modic Changes and Vertebral Marrow
Modic Endplate Classification
Modic changes are vertebral endplate and subchondral marrow signal changes associated with degenerative disc disease. They are classified into three types based on their MRI signal characteristics:
- T1 Signal
- Dark (hypointense)
- T2/STIR Signal
- Bright (hyperintense)
- Pathology
- Active oedema and inflammation in the endplate
- Clinical Correlation
- Most strongly associated with active low back pain; may convert to Type 2 or improve
- T1 Signal
- Bright (hyperintense)
- T2/STIR Signal
- Bright or isointense
- Pathology
- Fatty replacement of the endplate marrow
- Clinical Correlation
- Most common type; more stable; may or may not be symptomatic
- T1 Signal
- Dark (hypointense)
- T2/STIR Signal
- Dark (hypointense)
- Pathology
- Sclerotic bone in the endplate
- Clinical Correlation
- Least common; represents end-stage sclerosis; usually stable
Modic Type 1 changes are the most clinically significant type because they represent active inflammation and are most strongly associated with axial back pain. They may also indicate low-grade infection (Modic Type 1 changes can be an early sign of discitis/osteomyelitis and must be interpreted in clinical context). Some authors have advocated antibiotic treatment for persistent Modic Type 1 changes that fail to respond to conservative management (the Modic Antibiotic Spine Therapy concept), though this remains controversial. Modic Type 1 changes may progress to Type 2 (fatty) over time or may persist and remain symptomatic.
1-2-3Modic Changes Classification
Hook:Modic 1-2-3: Oedema (active) → Fat (stable) → Sclerosis (end-stage). Type 1 correlates with pain, Type 2 is most common, Type 3 is rare.
Systematic Approach
Systematic Bone Marrow Assessment on MRI
- Assessment
- Compare marrow signal to adjacent muscle on T1-weighted images
- Key Question
- Is marrow brighter or darker than muscle? Normal marrow is ALWAYS brighter than muscle on T1
- Assessment
- Check for bright signal on STIR indicating oedema or pathology
- Key Question
- Is there abnormal bright STIR signal? Where is it located? Is it focal, multifocal, or diffuse?
- Assessment
- Assess whether signal changes are focal, multifocal, or diffuse
- Key Question
- Focal = fracture, tumour, or infection. Multifocal = metastases, myeloma. Diffuse = systemic disease, reconversion
- Assessment
- Correlate T1, T2, and STIR signal to characterise the type of abnormality
- Key Question
- T1 dark + STIR bright = oedema. T1 dark + T2 dark = sclerosis. T1 bright = fat. Enhancement = vascular
- Assessment
- Look for fracture lines, cortical disruption, periosteal reaction, soft tissue mass
- Key Question
- These features narrow the differential: fracture line in stress injury, cortical disruption in tumour or infection
- Assessment
- Correlate the pattern with the patient's age, history, and presenting symptoms
- Key Question
- Diffuse marrow oedema in a child may be normal red marrow; in an elderly patient may be metastatic disease
The single most important rule in bone marrow MRI assessment is: normal bone marrow is ALWAYS brighter than muscle on T1-weighted images. If you see marrow that is darker than or equal in signal to muscle on T1, it is abnormal and requires further evaluation. This simple rule will catch the majority of significant marrow pathology.
Marrow Conversion and Reconversion
Normal Marrow Conversion
Understanding normal marrow conversion is essential for avoiding misdiagnosis, particularly in children, adolescents, and young adults where residual red marrow may mimic pathology.
- Distribution
- Entire skeleton contains red marrow
- MRI Appearance
- Diffusely intermediate-low T1 signal throughout skeleton — different from adult pattern
- Distribution
- Distal appendicular conversion well advanced (hands, feet converted to yellow)
- MRI Appearance
- Distal extremities now T1 bright; axial skeleton remains intermediate
- Distribution
- Epiphyses, diaphyses largely converted; metaphyses and axial skeleton still have red marrow residua
- MRI Appearance
- Most of the long bone shafts are now T1 bright; patchy metaphyseal areas may still be intermediate
- Distribution
- Adult pattern established: yellow marrow except for axial skeleton, proximal femora, proximal humeri
- MRI Appearance
- Normal adult T1 bright marrow; residual red marrow in expected locations
- Distribution
- Stable yellow marrow distribution; slow conversion of residual red marrow continues with age
- MRI Appearance
- T1 bright throughout most of the appendicular skeleton; redder with reconversion stimuli
Red Marrow Reconversion
Under certain physiological and pathological conditions, yellow marrow can reconvert back to red marrow in the reverse pattern (proximal to distal, metaphysis to diaphysis). This reconversion increases the proportion of red (haematopoietic) marrow at the expense of yellow (fatty) marrow.
- Red Marrow Reconversion
- Symmetric; follows expected pattern (proximal to distal)
- Pathological Infiltration
- Often asymmetric, random, or focal
- Red Marrow Reconversion
- Slightly less bright than fat but STILL BRIGHTER than muscle
- Pathological Infiltration
- Darker than muscle on T1
- Red Marrow Reconversion
- Mild increase; less intense than frank oedema
- Pathological Infiltration
- Markedly bright on STIR
- Red Marrow Reconversion
- Scattered fat signal (small foci of T1 bright) within the marrow
- Pathological Infiltration
- Complete replacement of fat signal — no residual bright T1 foci
- Red Marrow Reconversion
- Mild, homogeneous if present
- Pathological Infiltration
- Avid, heterogeneous, may show mass effect
- Red Marrow Reconversion
- Chronic anaemia, heavy smoking, obesity, long-distance running, chronic illness
- Pathological Infiltration
- Metastases, lymphoma, leukaemia, myeloma, primary bone tumours
Differential Diagnosis of Marrow Signal
Differentiating Marrow Signal Abnormalities
The commonest examination scenario is a marrow signal abnormality where the candidate must generate and prioritise a differential. The decisive variables are the T1 signal relative to muscle, the STIR/T2 behaviour, the distribution, and the presence of an associated fracture line, mass or soft-tissue component.
- T1
- Slightly reduced but STILL brighter than muscle, retains fat foci
- STIR/T2
- Mildly increased
- Distinguishing Feature
- Symmetric, expected sites, no mass, signal does not drop below muscle
- T1
- Linear low-signal line replacing bright marrow
- STIR/T2
- Bright oedema, often beyond the fracture line
- Distinguishing Feature
- Identifiable fracture line; site-typical (femoral neck, tibia, metatarsal)
- T1
- Serpentine low-signal band, geographic lesion
- STIR/T2
- Double line sign; oedema in advanced disease
- Distinguishing Feature
- Subchondral, epiphyseal location with sclerotic rim and viable fat centrally early
- T1
- Confluent marrow replacement (T1 dark)
- STIR/T2
- Bright; rim-enhancing collections
- Distinguishing Feature
- Cortical breach, sinus tract, disproportionate soft-tissue oedema, penumbra sign
- T1
- Darker than muscle, complete fat replacement
- STIR/T2
- Variable, often bright; avid enhancement
- Distinguishing Feature
- Focal/multifocal, asymmetric, may show mass effect or cortical destruction
- T1
- Diffuse low signal across femoral head and neck
- STIR/T2
- Diffuse bright oedema
- Distinguishing Feature
- NO double line, NO geographic lesion; self-limiting, migratory
- T1
- Dark at the endplate
- STIR/T2
- Bright at the endplate
- Distinguishing Feature
- Subchondral endplate location at a degenerate disc; mirror-image across the disc
- T1
- Dark
- STIR/T2
- Dark on all sequences
- Distinguishing Feature
- Low signal on T1 AND T2/STIR; history of radiation, Paget changes, or chronic infection
The highest-value discriminator in this whole topic is the T1 signal relative to muscle combined with whether residual fat is preserved within the lesion. Benign red marrow keeps interspersed fat and never drops below muscle signal; tumour infiltration completely replaces fat and falls to or below muscle signal. Chemical-shift (in-phase/opposed-phase) imaging exploits exactly this: benign fat-containing marrow loses signal on opposed-phase images, whereas tumour that has replaced the fat does not.
Beyond conventional T1/STIR, diffusion-weighted imaging (DWI) is now central to assessing diffuse marrow disease (myeloma, metastatic infiltration). Highly cellular tumour restricts water diffusion, so it remains bright at high b-values with a low apparent diffusion coefficient (ADC), whereas normal fatty and benign red marrow do not. Whole-body MRI (T1 plus STIR plus DWI from skull to mid-thigh) is recommended by myeloma guidelines (IMWG): it detects focal and diffuse marrow infiltration earlier than skeletal survey, and more than one focal marrow lesion on whole-body MRI is itself a myeloma-defining event. Myeloma marrow has recognised patterns — normal, focal, diffuse, "variegated"/salt-and-pepper, and combined. An important caveat for treatment monitoring: effective therapy can paradoxically raise the ADC (tumour necrosis and liquefaction), so falling cellularity is interpreted alongside the conventional sequences, and ADC response thresholds remain incompletely standardised.
Guidelines, Registries & Global Practice
Across every major examination system, MRI is regarded as the investigation of choice for suspected occult fracture, stress injury, avascular necrosis, osteomyelitis and marrow infiltration, because bone marrow signal change precedes radiographic change by weeks to months. The cardinal principle — loss of normal T1 fatty (bright) marrow signal — is universal and not country-specific.
- Position on MRI for Marrow Pathology
- Hip fracture guidance recommends MRI when a fracture is suspected despite normal radiographs; if MRI is contraindicated or not available within 24 hours, CT is the accepted alternative.
- Position on MRI for Marrow Pathology
- Supports advanced imaging (MRI preferred, CT acceptable) for the occult hip fracture and emphasises MRI for suspected osteonecrosis and infection where radiographs are inconclusive.
- Position on MRI for Marrow Pathology
- Frames MRI as the modality of choice for early stress injury, osteonecrosis staging and infection, using STIR/fat-suppressed sequences to detect marrow oedema.
- Position on MRI for Marrow Pathology
- Endorses MRI-based osteonecrosis classification (ARCO) and MRI for early marrow change in infection and tumour; promotes standardised whole-body MRI protocols for myeloma.
- Position on MRI for Marrow Pathology
- Whole-body MRI (or diffusion-weighted MRI) is recommended for marrow assessment; more than one focal marrow lesion is a myeloma-defining event.
Global epidemiology and registry context. Femoral neck fragility fractures number in the millions worldwide each year, and a meaningful minority are radiographically occult at presentation — the driver for rapid MRI access. National hip-fracture registries (for example the UK National Hip Fracture Database and equivalents in the Nordic countries, Australia and New Zealand) consistently link early definitive diagnosis and surgery to lower morbidity, which underpins the 24-hour MRI recommendation. Arthroplasty registries (NJR for England and Wales, AJRR in the US, AOANJRR in Australia, and the Swedish and Norwegian registries) report on osteonecrosis and periprosthetic bone quality as factors in revision, where MRI marrow signal informs pre-operative planning.
High- versus limited-resource practice variation. Where MRI is freely available it is the first advanced test for occult fracture, osteonecrosis and infection. In limited-resource or after-hours settings, CT is widely substituted for the occult hip fracture (it detects most though not all non-displaced fractures), and a delayed repeat radiograph at 10-14 days or a technetium bone scan may be used when cross-sectional imaging is inaccessible. For marrow infiltration and myeloma, diffusion-weighted whole-body MRI is expanding in high-resource centres but skeletal survey or low-dose whole-body CT remains the practical alternative elsewhere.
Controversies & Areas of Uncertainty
Controversies and Evolving Practice
The hypothesis that some Modic Type 1 changes reflect low-virulence disc infection (notably Cutibacterium acnes) led to trials of prolonged oral antibiotics for chronic low back pain. Early results were promising but later, better-controlled studies and meta-analyses have been inconsistent, and concerns about antibiotic stewardship persist. Routine antibiotic therapy for Modic Type 1 change is NOT standard practice and remains investigational.
MRI is the most sensitive test for the occult hip fracture, but multidetector CT detects most non-displaced fractures and is faster and cheaper. Debate continues over whether CT is an adequate first-line substitute. The pragmatic global position is MRI first where available within 24 hours, with CT reserved for when MRI is contraindicated, not tolerated, or unavailable — accepting a small false-negative rate for CT.
'Bone marrow oedema' on STIR is sensitive but profoundly non-specific. Subchondral bone marrow lesions in osteoarthritis, post-traumatic contusion, reactive change adjacent to enthesopathy, and early infection can look similar. The term 'bone marrow oedema-like signal' is preferred because true interstitial oedema is only one of several histological substrates (which also include necrosis, fibrosis and marrow fat loss).
Diffusion-weighted whole-body MRI is increasingly used for myeloma and metastatic marrow disease and is endorsed by myeloma guidelines, but protocol standardisation, apparent diffusion coefficient thresholds for treatment response, and access remain unsettled, especially outside specialist centres.

Clinical Decision Scenarios
Practise clinical reasoning and management decisions out loud
“A 65-year-old woman presents with hip pain after a fall. Plain radiographs of the pelvis are reported as normal. You are shown an MRI of the hip.”
“You are shown an MRI of the hip in a 40-year-old male on long-term corticosteroids. The T2-weighted image shows a serpentine line in the femoral head with an inner bright band and outer dark band.”
“An examiner shows you an MRI of the lumbar spine with bright T1 and bright T2 signal in the endplates of L4/5, and asks you to classify and discuss the changes.”
“A 38-year-old long-distance runner who smokes and is mildly anaemic has an MRI of both knees for anterior knee pain. The report describes patchy low T1 signal in the distal femoral and proximal tibial metaphyses bilaterally, with mild STIR hyperintensity.”
Normal Marrow Assessment
- Normal marrow is T1 BRIGHT (brighter than muscle) — due to fat content
- If marrow is darker than muscle on T1, it is abnormal
- Conversion: distal to proximal, diaphysis to metaphysis (complete by age 25)
- Red marrow reconversion is proximal to distal (reverse of conversion)
Pathological Patterns
- Oedema: T1 dark, STIR bright (FISTS: Fracture, Infection, Surgery, Tumour, Stress)
- Fatty replacement: T1 bright, STIR suppressed (chronic change)
- Fibrosis/Sclerosis: T1 dark, T2 dark (Paget, chronic infection, radiation)
- Infiltration: T1 dark, complete fat replacement, enhancement with gadolinium
AVN Diagnosis
- Double line sign on T2 is pathognomonic (100% specific)
- Outer dark line = reactive sclerosis; inner bright line = granulation tissue
- Must scan bilaterally — 80% bilateral in steroid-related AVN
- Distinguish from transient osteoporosis: TOH has diffuse oedema WITHOUT double line
Modic Changes
- Type 1: T1 dark, T2 bright = oedema (PAIN associated; most clinically significant)
- Type 2: T1 bright, T2 bright = fat (MOST COMMON; stable)
- Type 3: T1 dark, T2 dark = sclerosis (LEAST COMMON; end-stage)
- Must exclude discitis if clinical features suggest infection
Stress Fracture Grading (Fredericson)
- Grade 1: Periosteal oedema only (STIR positive, T1 normal)
- Grade 2: Marrow oedema on STIR, T1 normal
- Grade 3: Marrow oedema on BOTH T1 (dark) and STIR (bright)
- Grade 4: Visible fracture line — Grade 4b is a complete stress fracture
Evidence Base
MRI versus CT for Occult Hip Fractures
- In 13 elderly patients (mean age 73) with hip pain after a fall and normal radiographs, MRI and CT were compared for detecting occult fractures.
- In the subgroup imaged with both, 4 of 6 CT studies gave a misdiagnosis due to inaccuracy, whereas every MRI study yielded an accurate, prompt diagnosis.
- The authors concluded MRI is more accurate than CT for early diagnosis of occult hip fractures, enabling effective treatment and shorter admission.
MRI for Diagnosing Foot Osteomyelitis
- Pooled across 16 studies of suspected foot/ankle osteomyelitis (many in diabetes), MRI had a diagnostic odds ratio of 42.1 (95% CI 14.8 to 119.9).
- At a 90% sensitivity cut-point the specificity was 82.5%, so marrow signal change on MRI can both rule in and rule out infection.
- MRI markedly out-performed technetium-99m bone scan (DOR 149.9 vs 3.6), plain radiography (81.5 vs 3.3) and white-cell studies (120.3 vs 3.4) in head-to-head comparisons.
Diagnostic evidence strongly supports MRI for occult fractures and infection.