Statistical Significance | Effect Estimation | Clinical Interpretation
- P-Value: Probability of observing data as extreme as yours IF null hypothesis is true. NOT probability that null is true.
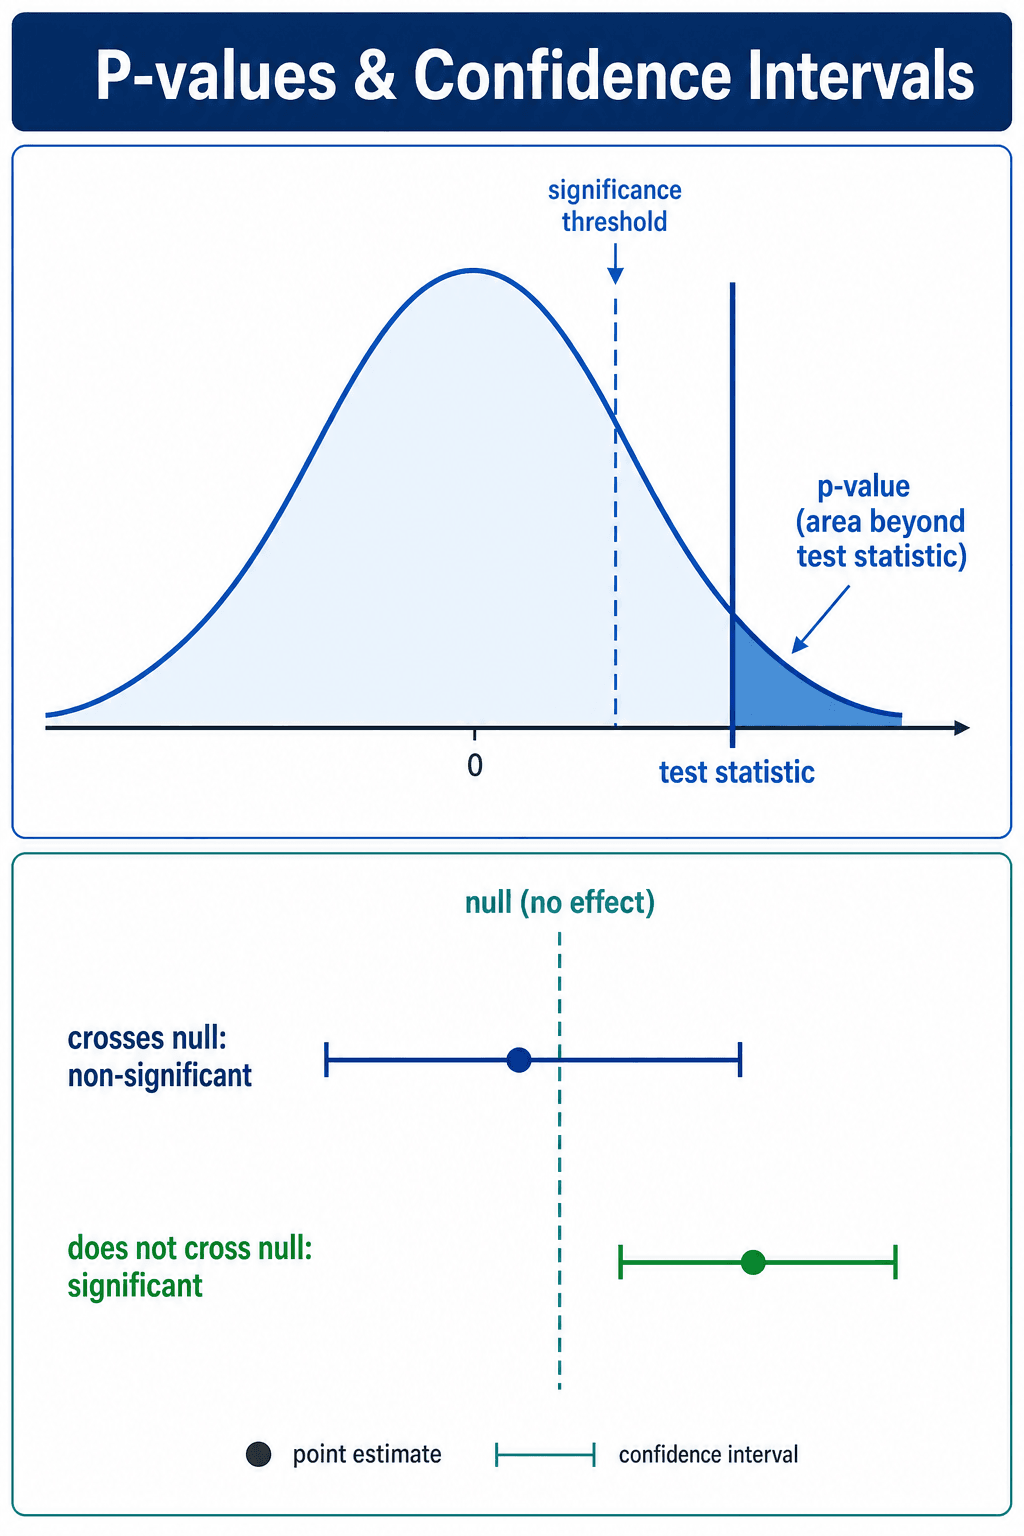
- Confidence Interval (95% CI): Range of plausible values for true effect. If repeated many times, 95% of CIs would contain true value.
- Statistical Significance (p less than 0.05): Does NOT equal clinical importance. Must compare effect to MCID.
- CI Interpretation: If 95% CI excludes null (0 for difference, 1 for ratio), result is statistically significant at p less than 0.05.
- CI Width: Narrow CI = precise estimate. Wide CI = imprecise, underpowered study.
- “p = 0.05 is arbitrary threshold - not magic cutoff between real and unreal
- “p-value depends on sample size - large studies find significance in trivial differences
- “CI provides effect size AND significance - more informative than p-value alone
- “CI that crosses MCID suggests effect may not be clinically meaningful
Common Misconceptions: p-value is NOT (1) probability null is true, (2) probability of Type I error, (3) proof of effect size, or (4) measure of clinical importance.
Correct Interpretation: p = 0.03 means if null hypothesis is true, there is 3% chance of observing data this extreme or more extreme by random chance alone.
Advantage: CI shows effect size, direction, precision, and statistical significance. p-value only shows significance, not magnitude.
Critical Distinction: p less than 0.05 means statistically significant. Clinical significance requires effect to exceed MCID. Can have one without the other.
PENTP-Value Common Misinterpretations
Hook:Do not get PENT up in p-value misinterpretations - these are what p-value is NOT!
Overview/Introduction
What Are P-Values and Confidence Intervals?
P-values and confidence intervals (CIs) are the two primary tools for statistical inference in orthopaedic research. They address different but complementary questions:
- P-value: Tests whether observed data are compatible with the null hypothesis (no effect/difference)
- Confidence interval: Estimates the range of plausible values for the true effect
Why This Matters: Misinterpretation of p-values is pervasive in medical literature. Understanding these concepts prevents overconfident claims from underpowered studies and helps distinguish statistically significant but clinically trivial findings from truly meaningful results.
Historical Context: Ronald Fisher introduced p-values in the 1920s as a continuous measure of evidence against the null hypothesis. The 0.05 threshold became convention, not scientific law. Jerzy Neyman and Egon Pearson later developed confidence intervals in the 1930s as a complementary approach to estimation.
Current Emphasis: Modern statistical guidelines (ASA 2016, CONSORT, STROBE) emphasize reporting effect sizes and confidence intervals over dichotomous p-value thresholds. Journals increasingly require CIs alongside or instead of p-values.
Clinical Relevance in Orthopaedics:
- Distinguishing statistical significance from clinical importance (MCID)
- Interpreting RCT results for treatment decisions
- Evaluating diagnostic test accuracy studies
- Assessing prognostic factor analyses
- Critical appraisal for exam vivas and clinical practice
Understanding p-values and CIs is essential for evidence-based orthopaedic practice and exam success.
Principles of Statistical Inference
Fundamental Definitions
P-Value (Probability Value):
- Definition: The probability of observing data as extreme as, or more extreme than, what was observed, assuming the null hypothesis is true
- Formula: p = P(Data | H₀ is true)
- NOT: p ≠ P(H₀ is true | Data) - this is the most common error
- Range: 0 to 1 (often expressed as 0 to 100%)
Confidence Interval (CI):
- Definition: A range of values that, if the study were repeated many times, would contain the true population parameter in 95% of studies (for 95% CI)
- Components: Point estimate (observed effect) ± margin of error
- Interpretation: Provides effect size, direction, precision, and significance simultaneously
- NOT: There is NOT a 95% probability the true value is in this specific CI (frequentist interpretation forbids this)
Null Hypothesis (H₀):
- Definition: Statement of no effect, no difference, or no association
- Examples:
- Mean difference = 0
- Risk ratio = 1
- Correlation coefficient = 0
Alternative Hypothesis (H₁):
- Definition: Statement that there IS an effect, difference, or association
- Can be: Two-sided (any difference) or one-sided (specific direction)
Relationship Between P-Values and Confidence Intervals
Key Connection: P-values and confidence intervals are mathematically related:
- For 95% CI: If the CI excludes the null value (0 for differences, 1 for ratios), then p less than 0.05
- For 99% CI: If the CI excludes the null value, then p less than 0.01
- For 90% CI: If the CI excludes the null value, then p less than 0.10
Why This Matters: You can determine statistical significance directly from the confidence interval without needing the p-value. This is why modern guidelines emphasize CIs over p-values - they provide MORE information (effect size, precision, AND significance).
Understanding P-Values
What is a P-Value?
Definition: The probability of observing data as extreme as, or more extreme than, the observed data, assuming the null hypothesis is true.
Null Hypothesis (H₀): There is no difference between groups or no effect.
Formula: p = P(Data | H₀ is true)
Interpreting P-Values
- Interpretation
- Very strong evidence against null
- Conclusion
- Highly statistically significant
- Action
- Check effect size and clinical relevance
- Interpretation
- Moderate evidence against null
- Conclusion
- Statistically significant
- Action
- Check confidence interval and MCID
- Interpretation
- Weak evidence, borderline
- Conclusion
- Not statistically significant
- Action
- Consider if underpowered, examine trend
- Interpretation
- Little evidence against null
- Conclusion
- Not statistically significant
- Action
- Check power, may be true null or Type II error
Key Point: p = 0.051 is NOT fundamentally different from p = 0.049. The 0.05 threshold is arbitrary convention, not natural boundary.
Common P-Value Misconceptions
What P-Value Does NOT Tell You
Misconception 1: p-value is the probability that the null hypothesis is true.
- WRONG: p assumes null is true, then calculates probability of data.
- Correct: p is P(Data | Null is true), NOT P(Null is true | Data).
Misconception 2: p-value is the probability of a Type I error.
- WRONG: Type I error rate is alpha (set before study, usually 0.05).
- Correct: p-value is calculated from observed data, alpha is pre-set threshold.
Misconception 3: p-value tells you the size of the effect.
- WRONG: p-value reflects both effect size AND sample size.
- Correct: Large sample can yield p less than 0.05 for trivial effects.
Misconception 4: p greater than 0.05 proves null hypothesis.
- WRONG: Failure to reject null does not prove null is true.
- Correct: May be underpowered (Type II error) or true null.
Understanding these misconceptions prevents misinterpretation.
Understanding Confidence Intervals
What is a Confidence Interval?
Definition: A range of values that likely contains the true population parameter.
95% CI Interpretation: If we repeated the study many times, 95% of the confidence intervals calculated would contain the true effect.
NOT: There is a 95% probability the true value is in this CI (frequentist interpretation).
Relationship Between CI and P-Value
For 95% CI: If the confidence interval excludes the null value (0 for differences, 1 for ratios), the result is statistically significant at p less than 0.05.
For 99% CI: Corresponds to p less than 0.01 threshold.
For 90% CI: Corresponds to p less than 0.10 threshold.
CI Components
- Meaning
- Best guess of true effect
- Example (Mean Difference)
- Mean difference = 8 points
- Interpretation
- Observed effect in this sample
- Meaning
- Minimum plausible effect
- Example (Mean Difference)
- 95% CI: 2 to 14 points
- Interpretation
- True effect unlikely below 2
- Meaning
- Maximum plausible effect
- Example (Mean Difference)
- 95% CI: 2 to 14 points
- Interpretation
- True effect unlikely above 14
- Meaning
- Precision of estimate
- Example (Mean Difference)
- Width = 12 points (14 minus 2)
- Interpretation
- Wider = less precise, needs larger sample
REPSConfidence Interval Interpretation
Hook:Get good REPS with confidence intervals - they build stronger inference than p-values alone!
Commonly Confused Concepts (Differential)
Examiners frequently probe whether candidates can distinguish closely related statistical terms. The table below contrasts the concepts most often confused in vivas and the literature.
- What It Is
- Probability of data this extreme IF null is true
- What It Is Often Confused With
- Probability the null is true
- Key Discriminator
- Conditional direction: P(data | H0), not P(H0 | data)
- What It Is
- Pre-set acceptable Type I error rate
- What It Is Often Confused With
- The observed p-value
- Key Discriminator
- Alpha is fixed before the study; p is computed from the data
- What It Is
- Plausible range for the true effect (frequentist)
- What It Is Often Confused With
- Credible interval (Bayesian probability range)
- Key Discriminator
- Only a credible interval gives a direct probability for the parameter
- What It Is
- Effect unlikely under the null (p less than alpha)
- What It Is Often Confused With
- Clinical significance
- Key Discriminator
- Clinical significance needs the effect to exceed the MCID
- What It Is
- False positive: rejecting a true null
- What It Is Often Confused With
- Type II error (false negative)
- Key Discriminator
- Type I is alpha; Type II is beta (1 minus power)
- What It Is
- Spread of individual observations
- What It Is Often Confused With
- Standard error (spread of the mean estimate)
- Key Discriminator
- SE = SD / sqrt(n); SE shrinks with larger samples, SD does not
Bayesian Inference: Credible Intervals and Bayes Factors
The p-value and confidence interval are frequentist tools: they describe long-run behaviour and cannot give the direct probability statement clinicians actually want ("how likely is it that this treatment works?"). The Bayesian framework answers that question directly, at the cost of having to specify a prior.
- Frequentist
- How compatible are the data with the null?
- Bayesian
- How probable is the hypothesis given the data and prior belief?
- Frequentist
- Confidence interval (a long-run coverage statement)
- Bayesian
- Credible interval - genuinely a 95% probability the parameter lies within it
- Frequentist
- P-value (cannot support the null)
- Bayesian
- Bayes factor - ratio of the data's likelihood under each hypothesis, can favour the null
- Frequentist
- Counter-intuitive; gives no direct probability for the hypothesis
- Bayesian
- Requires choosing a prior, which can be subjective
By Bayes' theorem, the posterior is proportional to the likelihood times the prior: the observed data update a prior belief into a posterior. A credible interval is the Bayesian analogue of the confidence interval but permits the natural statement the frequentist CI forbids - a 95% probability the true value lies inside it. A Bayes factor quantifies how much the data shift the odds between two hypotheses and, unlike a p-value, can provide positive evidence in favour of the null. Bayesian methods are increasingly used in adaptive trials and evidence synthesis, but the dependence on the prior remains the central criticism.
A frequentist confidence interval is a long-run coverage statement; only a Bayesian credible interval lets you say there is a 95% probability the true effect lies within the range. The Bayes factor, unlike the p-value, can provide evidence in favour of the null - but Bayesian inference requires a prior, which is its main weakness.
Clinical Application
Statistical vs Clinical Significance
Four Possible Scenarios:
- Statistical Significance
- p less than 0.05, CI excludes 0
- Clinical Significance
- Effect exceeds MCID
- Interpretation
- Significant AND clinically meaningful - implement
- Statistical Significance
- p less than 0.05, CI excludes 0
- Clinical Significance
- Effect below MCID
- Interpretation
- Significant but trivial - do NOT implement
- Statistical Significance
- p greater than 0.05, CI includes 0
- Clinical Significance
- Point estimate exceeds MCID
- Interpretation
- Not significant but trend - need larger study
- Statistical Significance
- p greater than 0.05, CI includes 0
- Clinical Significance
- Effect well below MCID
- Interpretation
- No effect - do not implement
Key Principle: Always check if effect size (point estimate) and CI bounds exceed MCID, not just if p less than 0.05.
Worked Example: THA Study
Study: Compares cemented vs uncemented THA on WOMAC score at 1 year.
Results:
- Mean difference = 8 points (cemented better)
- 95% CI: 1 to 15 points
- p = 0.02
- MCID for WOMAC = 10 points
Interpretation:
- Statistically Significant: p = 0.02 less than 0.05, CI excludes 0 → Yes
- Point Estimate: 8 points less than MCID of 10 → Not clinically meaningful
- CI Upper Bound: 15 points greater than MCID → Could be meaningful
- CI Lower Bound: 1 point much less than MCID → Could be trivial
Conclusion: Result is statistically significant but clinically uncertain. The CI is wide and crosses the MCID threshold. Point estimate suggests effect may not be clinically important. Need larger study to narrow CI and determine if true effect exceeds 10 points.
Understanding this nuanced interpretation prevents overconfidence in borderline results.
Absolute and Relative Effect Measures (NNT)
For binary (yes/no) outcomes the same result can be expressed in absolute or relative terms, and the choice strongly affects how impressive it looks. Confidence intervals and significance apply to all of these measures, but clinical decisions depend on the absolute ones.
- Definition
- Control event rate minus experimental event rate
- Note
- The true clinical benefit; null value is 0
- Definition
- Experimental event rate divided by control event rate
- Note
- Null value is 1; common in cohort studies and RCTs
- Definition
- ARR divided by the control event rate (equals 1 minus RR)
- Note
- Looks large even when the ARR is small
- Definition
- 1 divided by the ARR (rounded up)
- Note
- Patients treated to prevent one extra bad outcome; lower is better
- Definition
- Odds in the exposed divided by odds in the unexposed
- Note
- Case-control and logistic regression; approximates RR only when the outcome is rare
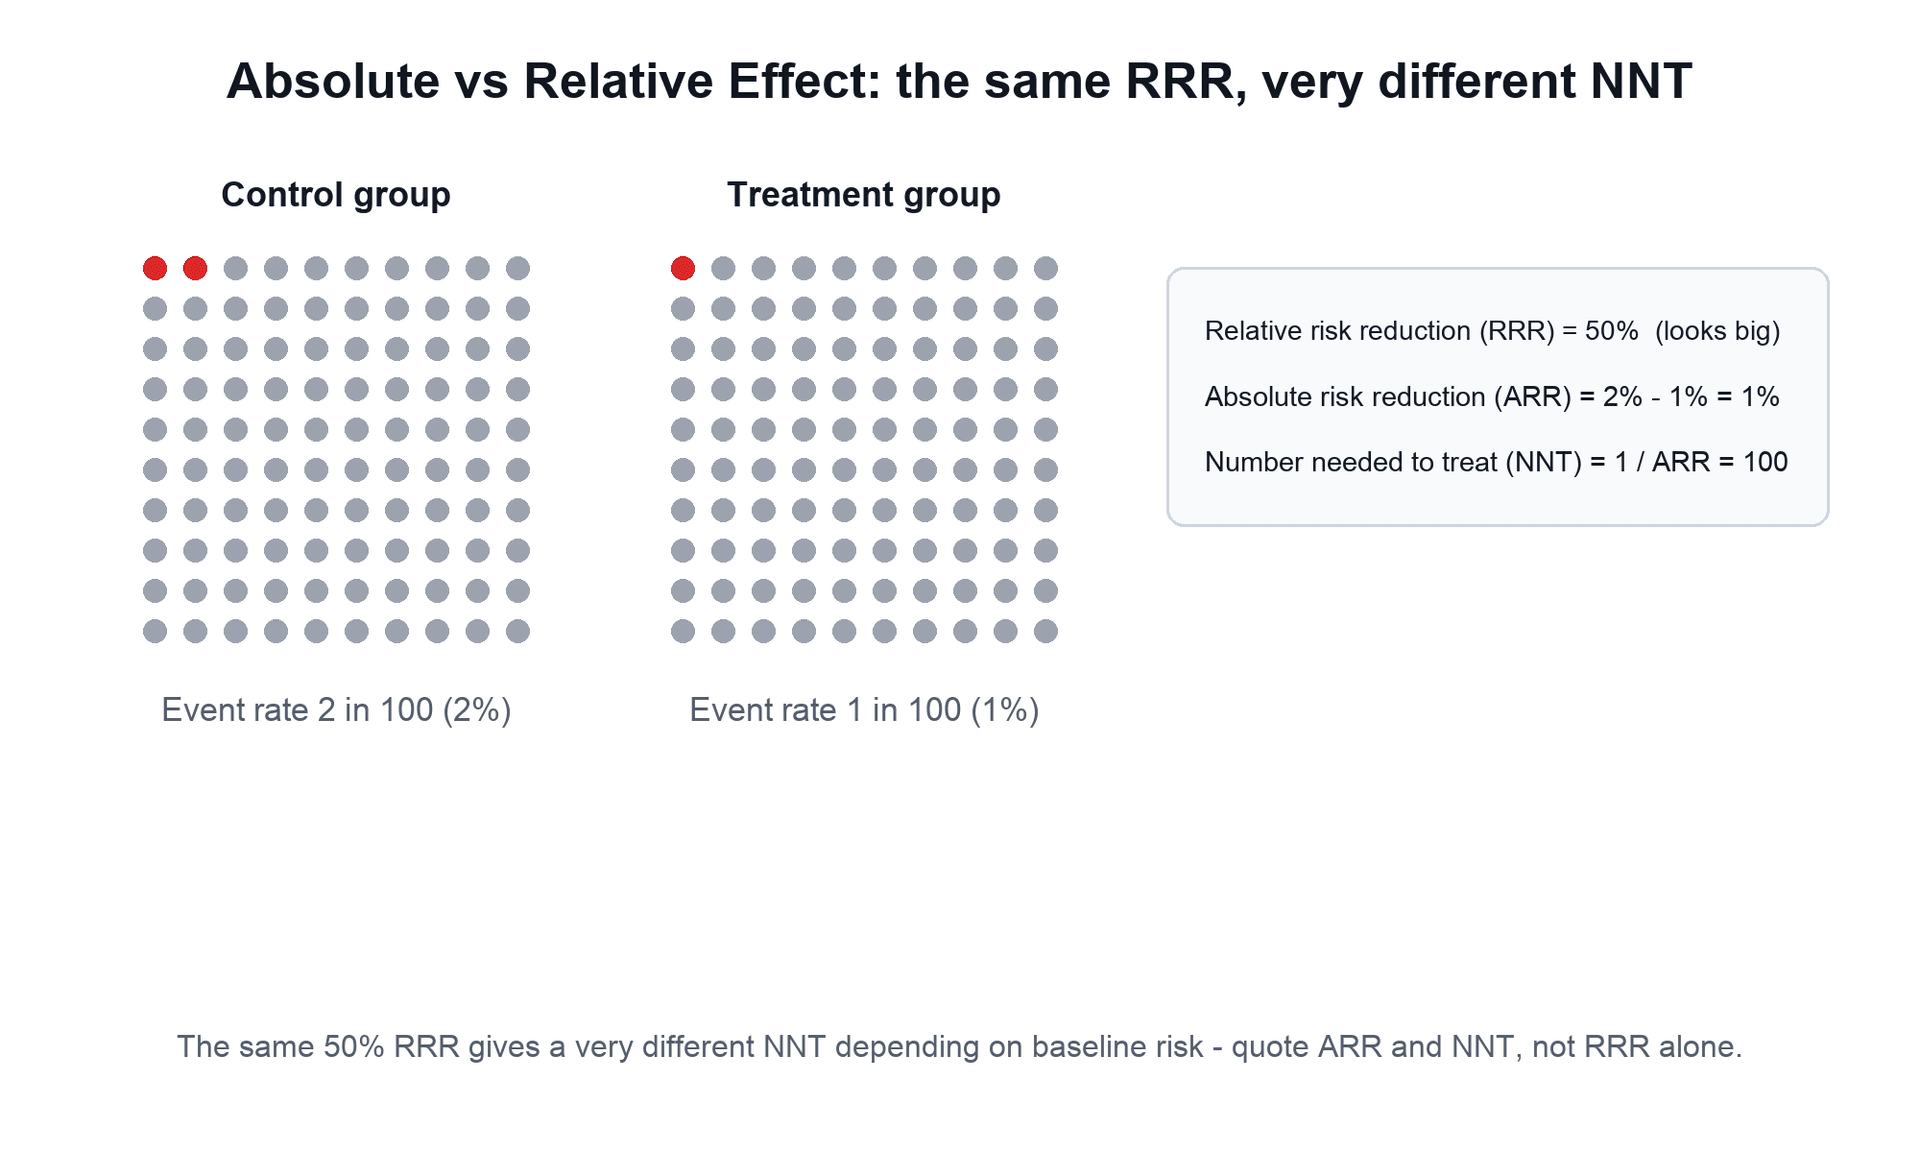
The key trap is the relative-versus-absolute distinction: a treatment that cuts risk from 2% to 1% has an impressive relative risk reduction of 50% but an ARR of only 1% and an NNT of 100. The RRR is identical whether the baseline risk is 2% or 50%, so a relative measure detached from baseline risk can badly mislead. The number needed to harm (NNH) is the analogous 1 divided by the absolute risk increase for adverse effects, and the NNT should always be quoted with its confidence interval.
Convert relative to absolute: a 50% relative risk reduction means little if the baseline risk is tiny. The number needed to treat is 1 divided by the absolute risk reduction, so the same RRR gives a very different NNT depending on baseline risk. Quote ARR and NNT (with confidence intervals), not RRR alone, when counselling patients.
Guidelines, Registries & Global Practice
Reporting Standards Across the Global Literature
Statistical reporting expectations are remarkably consistent worldwide because they are driven by international journal and methodology guidelines rather than national bodies. The candidate should know which guideline governs which study type.
- Scope
- Global statistical practice
- Position on P-Values and CIs
- Do not base conclusions on a single p threshold; report effect sizes and CIs
- Scope
- All biomedical manuscripts
- Position on P-Values and CIs
- Quantify findings with appropriate indicators of measurement error such as confidence intervals; avoid relying solely on hypothesis testing
- Scope
- RCT reporting
- Position on P-Values and CIs
- Report effect size and its precision (e.g. 95% CI) for primary and secondary outcomes
- Scope
- Cohort, case-control, cross-sectional
- Position on P-Values and CIs
- Give estimates with confidence intervals; report so as not to over-interpret p-values
- Scope
- Guidelines and meta-analyses
- Position on P-Values and CIs
- Judges imprecision largely by CI width relative to clinical decision thresholds (MCID)
Registries and Effect Estimation
Large national arthroplasty registries (NJR for England, Wales, Northern Ireland and the Isle of Man; AOANJRR Australia; SHAR Sweden; the Norwegian and New Zealand registries; AJRR USA) illustrate the practical primacy of confidence intervals over p-values. Because registry sample sizes run into hundreds of thousands, almost any difference reaches statistical significance. Registries therefore report hazard ratios and revision rates with narrow confidence intervals and interpret them against clinically meaningful thresholds, not against p = 0.05. This is the real-world embodiment of the large-sample problem: with very large n, statistical significance is near-guaranteed and effect size plus CI width become the only meaningful discriminators.
High- vs Limited-Resource Practice Variation
- Well-resourced settings: Routine access to statistical software and biostatistician support; journals enforce CI reporting and pre-registration, reducing selective p-value reporting.
- Limited-resource settings: Smaller single-centre studies predominate, raising the risk of underpowered analyses and Type II errors; wide confidence intervals are common and should be interpreted as inconclusive rather than negative.
- Universal principle: The interpretation of p-values and CIs does not change by country; what varies is study size, access to methodological support, and exposure to publication and reporting bias.
Whichever fellowship you sit (FRCS, FRACS, EBOT, ABOS, DNB/MS, MRCS, SICOT), the expected answer is identical: interpret the confidence interval against the MCID, never equate statistical with clinical significance, and treat the p-value as one continuous piece of evidence, not a verdict.
Controversies and Areas of Uncertainty
Statistical inference is an area of genuine, ongoing debate. Candidates who can articulate the controversy (not just recite rules) demonstrate consultant-level understanding.
Some authors propose lowering the threshold for new discoveries to p less than 0.005 to reduce false positives, while others argue for abandoning fixed thresholds entirely and reporting p-values as continuous evidence. No global consensus exists.
The 0.05 cut-off is a historical convention attributed to Fisher, not a scientific constant. Treating 0.049 and 0.051 as categorically different is statistically indefensible, yet remains common in practice and journal decisions.
Frequentist CIs and p-values dominate orthopaedic literature, but Bayesian methods (credible intervals, Bayes factors) give the direct probability statements clinicians intuitively want. Adoption is growing but uneven.
There is no universally agreed MCID for many orthopaedic PROMs, and anchor-based versus distribution-based methods can give different values for the same instrument, complicating the judgement of clinical importance.
Concern over irreproducible findings across biomedical science has been driven substantially by the misuse of p-values: p-hacking (analysing data many ways until p less than 0.05), selective reporting, and underpowered studies. The exam-relevant lesson is that a single significant p-value, especially from a small or post-hoc analysis, is weak evidence until replicated and judged against effect size and prior plausibility.
MCQ Practice Points
Q: What does a p-value of 0.04 mean? A: Assuming null hypothesis is true, there is 4% probability of observing data this extreme or more extreme by chance alone. It does NOT mean 4% probability null is true, nor 4% probability of Type I error, nor 4% effect size.
Q: A 95% CI for mean difference is -2 to 8 points. Is this statistically significant at alpha = 0.05? A: No - the CI includes 0 (no difference), meaning the result is NOT statistically significant. If CI excluded 0, p would be less than 0.05.
Q: Can a result be statistically significant but not clinically significant? A: Yes - large studies can detect tiny differences with p less than 0.05 that are below the MCID threshold. Statistical significance depends on sample size; clinical significance depends on whether effect exceeds MCID.
Q: What does a wide confidence interval indicate? A: Imprecise estimate due to small sample size or high variability. A wide CI crossing both clinically important and trivial effects means the study is inconclusive - you cannot determine if the true effect is meaningful or not. This indicates the study is underpowered and needs a larger sample.
Q: If p = 0.03, what is the probability this result is a false positive (Type I error)? A: Unknown - cannot be determined from p-value alone. Alpha (0.05) is the Type I error rate set BEFORE the study. The p-value (0.03) is calculated FROM the data. Many students confuse these - p-value is NOT the probability of Type I error for THIS specific result.
Q: Study shows no significant difference (p = 0.15) between two treatments. Can you conclude the treatments are equally effective? A: No - failure to reject null does NOT prove null is true. This could be: (1) True null (treatments truly equivalent), OR (2) Type II error (underpowered study missing a real difference). Check the power calculation - if power is below 80%, cannot trust negative result. To prove equivalence, need a specifically designed equivalence or non-inferiority trial.
Exam Viva Scenarios
Practise clinical reasoning and management decisions out loud
“A colleague shows you an RCT comparing two rehab protocols. The study found no significant difference (p = 0.08). She concludes the protocols are equivalent. How do you respond?”
“An RCT of 1000 patients found statistically significant improvement in WOMAC score with new treatment: mean difference = 3 points, 95% CI 1 to 5 points, p = 0.003. The MCID for WOMAC is 10 points. How do you interpret this?”
“A trial of a new fixation device reported no overall difference, but the authors highlight that in the subgroup of smokers aged over 65 the device was significantly better (p = 0.04). The company asks you to adopt the device for this subgroup. How do you respond?”
P-Value Interpretation
- p-value = P(Data | Null is true), NOT P(Null is true | Data)
- p less than 0.05 = statistically significant (arbitrary convention)
- p-value does NOT indicate effect size or clinical importance
- Large sample can yield p less than 0.05 for trivial effects
- p greater than 0.05 does NOT prove null hypothesis (may be underpowered)
Confidence Interval Interpretation
- 95% CI = range of plausible values for true effect
- If 95% CI excludes null (0 or 1), p less than 0.05
- Narrow CI = precise estimate; Wide CI = imprecise, underpowered
- CI provides effect size, precision, AND significance
- Check if entire CI exceeds MCID for clinical relevance
Statistical vs Clinical Significance
- Statistical significance = p less than 0.05, CI excludes null
- Clinical significance = effect exceeds MCID
- Can have statistical significance without clinical importance (large sample, trivial effect)
- Can have clinical importance without statistical significance (small sample, large effect)
- Always compare point estimate AND CI to MCID
Common Misconceptions
- p-value is NOT probability null is true
- p-value is NOT Type I error for this study (that is alpha)
- p greater than 0.05 does NOT prove equivalence (may be Type II error)
- 0.05 threshold is arbitrary, not magic cutoff
- CI contains more information than p-value alone
Clinical Application
- Report effect sizes and CIs, not just p-values
- Check if CI crosses MCID threshold for clinical uncertainty
- Wide CI suggests need for larger study
- Borderline p (0.05-0.10) may indicate trend, check power
- Non-inferiority trials prove equivalence; superiority trials do not
Evidence Base
ASA Statement on Statistical Significance and P-Values
- P-values can indicate how incompatible data are with a specified statistical model, but do NOT measure the probability that the studied hypothesis is true
- Scientific conclusions should NOT be based only on whether a p-value passes a specific threshold such as 0.05
- A p-value does NOT measure the size or importance of an effect, nor provide a good measure of evidence on its own
- Proper inference requires full reporting and transparency, plus effect sizes and confidence intervals
Confidence Intervals Rather Than P Values: Estimation Rather Than Hypothesis Testing
- Overemphasis on hypothesis testing and dichotomising results as significant or non-significant detracts from more useful estimation approaches
- Investigators are usually interested in the SIZE of the difference between groups, not merely whether it is statistically significant
- Confidence intervals present a plausible range for the population value and convey magnitude, direction, and precision
- CIs should be reported for major findings in both the main text and the abstract
A Dirty Dozen: Twelve P-Value Misconceptions
- Reviews twelve common p-value misconceptions and explains why each is wrong, e.g. treating p as the probability the null is true
- The p-value is a measure of evidence that is not part of any formal system of statistical inference, making its meaning easily misconstrued
- Contrasts the p-value with the Bayes factor, which has interpretability properties the p-value lacks
- The most serious error is believing the probability of a wrong conclusion can be calculated from a single experiment without external evidence
Statistical Tests, P Values, Confidence Intervals, and Power: A Guide to Misinterpretations
- Provides an explanatory list of 25 distinct misinterpretations of p-values, confidence intervals, and statistical power
- Selective analysis (choosing what to present based on the p-value obtained) can produce small p-values even when the test hypothesis is correct
- There is no interpretation of these concepts that is simultaneously simple, intuitive, correct, and foolproof
- Concludes with practical guidelines for improving statistical interpretation and reporting