Cyclic Loading | S-N Curves | Crack Propagation | Endurance Limit
- Fatigue failure occurs at stresses well below ultimate tensile strength due to cyclic loading
- S-N curve plots stress amplitude vs cycles to failure - fundamental fatigue characterization
- Endurance limit: stress below which infinite cycles can be sustained (ferrous metals)
- Paris law: da/dN = C(ΔK)^m describes stable crack propagation
- Implant design must consider 10^7-10^8 cycles for 10-20 year lifespan
- “Hip replacement sees 1-2 million cycles per year of walking
- “Notches and surface defects are stress concentration sites for crack initiation
- “Titanium has no true endurance limit (fatigue limit at 10^7 cycles)
- “Corrosion accelerates fatigue (fretting, crevice corrosion)
Overview and Mechanisms
Fatigue failure is the progressive structural damage that accumulates when a material is loaded cyclically at stresses below its yield strength, and so well below its ultimate tensile strength. A single load of that size may be safe, but 10^6 cycles of it cause damage to accumulate. Fatigue is responsible for the majority of mechanical failures in orthopaedic implants, among them plate fractures, screw breakage and prosthesis stem fractures in total hip arthroplasty.
Fatigue versus static failure. A static failure happens when a single load exceeds the material's strength, and it is predictable from the ultimate tensile strength: a ductile material yields before it fractures, a brittle one fractures suddenly. In fatigue, cyclic loads accumulate damage below yield and a crack grows progressively. The final fracture is sudden and looks brittle.
Three stages. The process runs through three stages in sequence:
- Crack initiation (Stage I). Microstructural damage accumulates until a crack nucleates at a stress concentration: a defect, a notch or the surface. Initiation takes 10-90% of fatigue life.
- Stable crack propagation (Stage II). The crack grows a stable amount with each cycle. This is the Paris law region, and the one in which beach marks form.
- Final fracture (Stage III). Once the crack reaches its critical length, the remaining section fails rapidly and unstably.
How many cycles. A hip replacement sees on the order of one to two million load cycles a year of walking, about 10^7 over a decade, which is why 10^7 is the conventional runout for implant fatigue testing. An implant meant to last 10-20 years must therefore survive 10^7-10^8 cycles; at two million cycles a year that is 20-40 million. Design stresses have to sit well below the fatigue limit.
The loads. Each implant is loaded in its own way:
- Hip stem: 2-5 MPa of cyclic stress
- Plate across a nonunion: repeated bending over hundreds of thousands of cycles
- Screw: cyclic shear and tension
Principles of S-N Curves and Endurance Limit
The S-N curve. The S-N (Wöhler) curve is the fundamental characterisation of fatigue: cyclic stress amplitude (S) plotted against the number of cycles to failure (N). It is generated by testing specimens at a range of stress levels and recording the cycles to failure at each. High stress gives few cycles and low stress many; a horizontal asymptote, where the material has one, is the endurance limit.
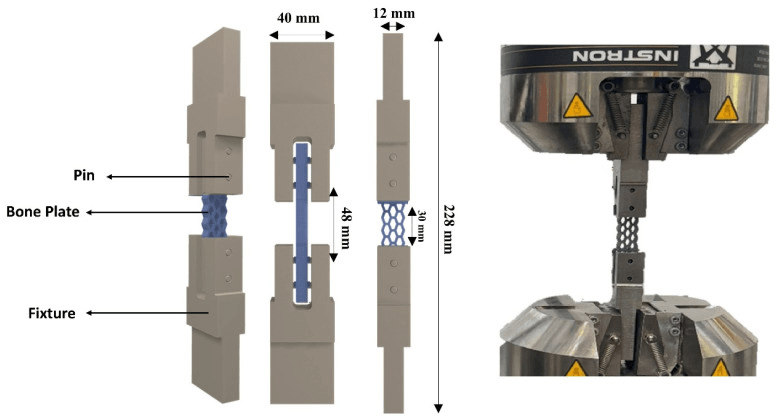
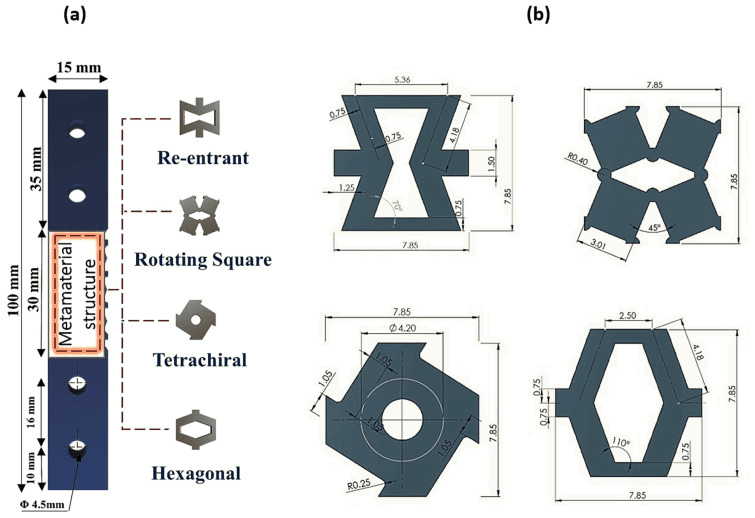
High- and low-cycle fatigue. Failure at low stress after more than 10^5 cycles is high-cycle fatigue. Failure at high stress in fewer than 10^5 cycles is low-cycle fatigue.
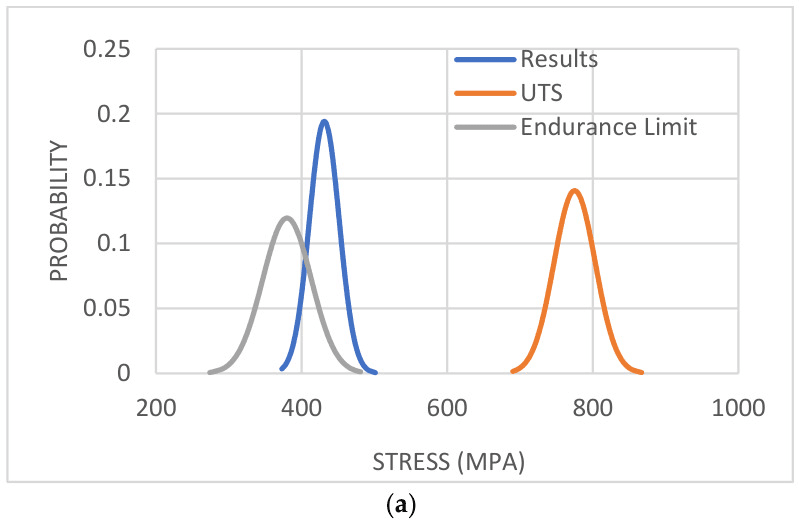
Endurance limit and fatigue limit. Ferrous metals such as steel have a true horizontal asymptote, the endurance limit: a stress below which infinite cycles can be sustained. In non-ferrous metals, titanium and aluminium among them, the curve keeps declining, so a practical fatigue limit is quoted instead at 10^6 or 10^7 cycles. For titanium alloys it is defined at 10^7 cycles, about 60% of UTS.
- Endurance Limit
- Yes (~200 MPa)
- Fatigue Strength at 10^6 cycles
- ~40% UTS
- Clinical Example
- Plates, screws
- Endurance Limit
- No true limit
- Fatigue Strength at 10^6 cycles
- ~60% UTS at 10^7
- Clinical Example
- Stems, cages
- Endurance Limit
- No true limit
- Fatigue Strength at 10^6 cycles
- ~40-50% UTS at 10^7
- Clinical Example
- Femoral heads, stems
- Endurance Limit
- No
- Fatigue Strength at 10^6 cycles
- Low fatigue resistance
- Clinical Example
- Cement mantle
The titanium S-N curve keeps falling even beyond 10^7 cycles, so design stress for a long-term implant (20+ years) must account for 10^8+ cycles. A factor of safety of 2-3 is typically applied to the fatigue limit.
Mean stress and stress ratio. Fatigue life depends on the mean stress and the stress ratio as well as on the amplitude:
- Stress amplitude σ_a = (σ_max - σ_min) / 2
- Mean stress σ_m = (σ_max + σ_min) / 2
- Stress ratio R = σ_min / σ_max
The Goodman relationship. Higher mean stress reduces fatigue life. The Goodman diagram plots allowable stress amplitude against mean stress, and the safe region lies below the line.
Cumulative Damage: From Constant-Amplitude S-N to Real Loading
From one stress level to many. The S-N curve and the 20-40 million cycle design figure both assume constant-amplitude loading. A real implant sees a spectrum instead: level walking, stair climbing, rising from a chair, and the occasional stumble or near-fall. The classical bridge from constant-amplitude laboratory data to this variable physiological loading is the Palmgren–Miner linear cumulative damage rule.
Miner's rule. Each block of n cycles at a stress level whose constant-amplitude life, read off the S-N curve, is N consumes a fraction n / N of the total fatigue life. Failure is predicted when the fractions sum to one:
Σ (n / N) = 1
Why a stumble matters more than the steps. The high-stress part of the S-N curve is steep, so at high stress the constant-amplitude life N is very small. A small number of high-amplitude events (a stumble, a fall onto the limb, stair-climbing in a heavy patient) therefore consumes a disproportionate share of fatigue life. Peak load, patient weight and activity level dominate fatigue life far more than raw step count.
Spectrum, not count. A count of gait cycles is necessary but not sufficient: the loading spectrum, meaning how many high-amplitude events there are, governs survival. That is why pre-market test standards specify a defined cyclic load amplitude and a run-out target, not merely a number of cycles.
A deliberate simplification. The rule is linear and ignores the order of loading and the interaction between loads, since an overload can locally retard or accelerate subsequent crack growth. The real damage sum at failure therefore scatters around one rather than equalling it exactly. It remains the standard first-pass life-prediction tool.
Crack Propagation and Paris Law
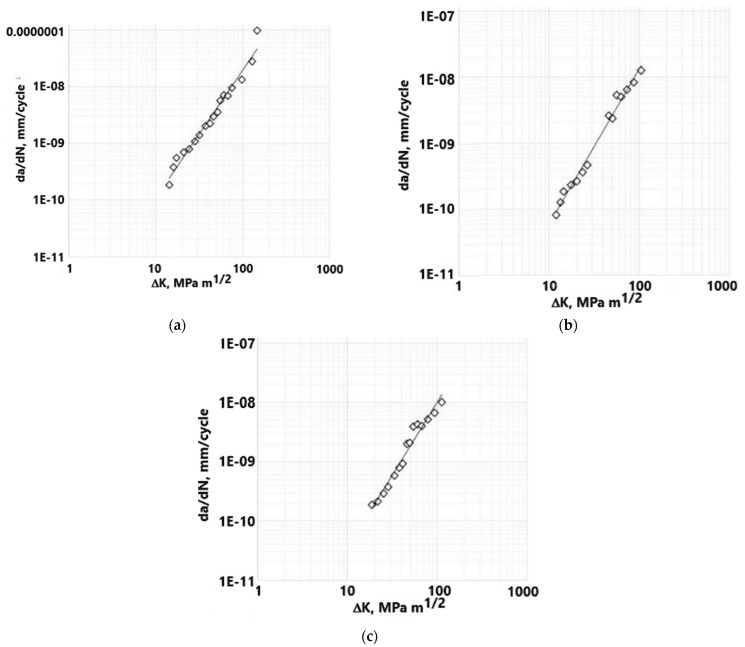
Paris law. In the stable propagation region (Stage II), the rate of crack growth per cycle follows Paris law:
da/dN = C (ΔK)^m
- da/dN is the crack growth rate, in metres per cycle
- ΔK is the stress intensity factor range, K_max - K_min
- C and m are material constants, m typically 2-4
The stress intensity factor. K = Y × σ × sqrt(π × a), where Y is a geometry factor, σ the applied stress and a the crack length. As the crack grows, a increases and K with it, so the growth rate accelerates until K reaches K_IC, the fracture toughness, and final fracture occurs.
What follows from the law. Small cracks grow very slowly because ΔK is low, and growth then accelerates as a power of ΔK, the exponent m. Fatigue life therefore depends heavily on the initial defect size, and inspection can detect a crack before it reaches critical size.
What speeds a crack. The environment, the surface, residual stress and the microstructure all change how fast a crack starts or grows:
- Effect on Propagation
- Accelerates growth
- Mechanism
- Corrosion fatigue, stress corrosion cracking
- Prevention Strategy
- Passivation, coatings
- Effect on Propagation
- Faster initiation
- Mechanism
- Stress risers at surface
- Prevention Strategy
- Polishing, shot peening
- Effect on Propagation
- Accelerates
- Mechanism
- Adds to applied stress
- Prevention Strategy
- Compressive residual stress
- Effect on Propagation
- Can slow or accelerate
- Mechanism
- Depends on orientation
- Prevention Strategy
- Optimize microstructure
SCRAMSFactors Affecting Fatigue Life
Hook:Fatigue SCRAMS your implant over time!
Reading the Fatigue Fracture Surface (Fractography)
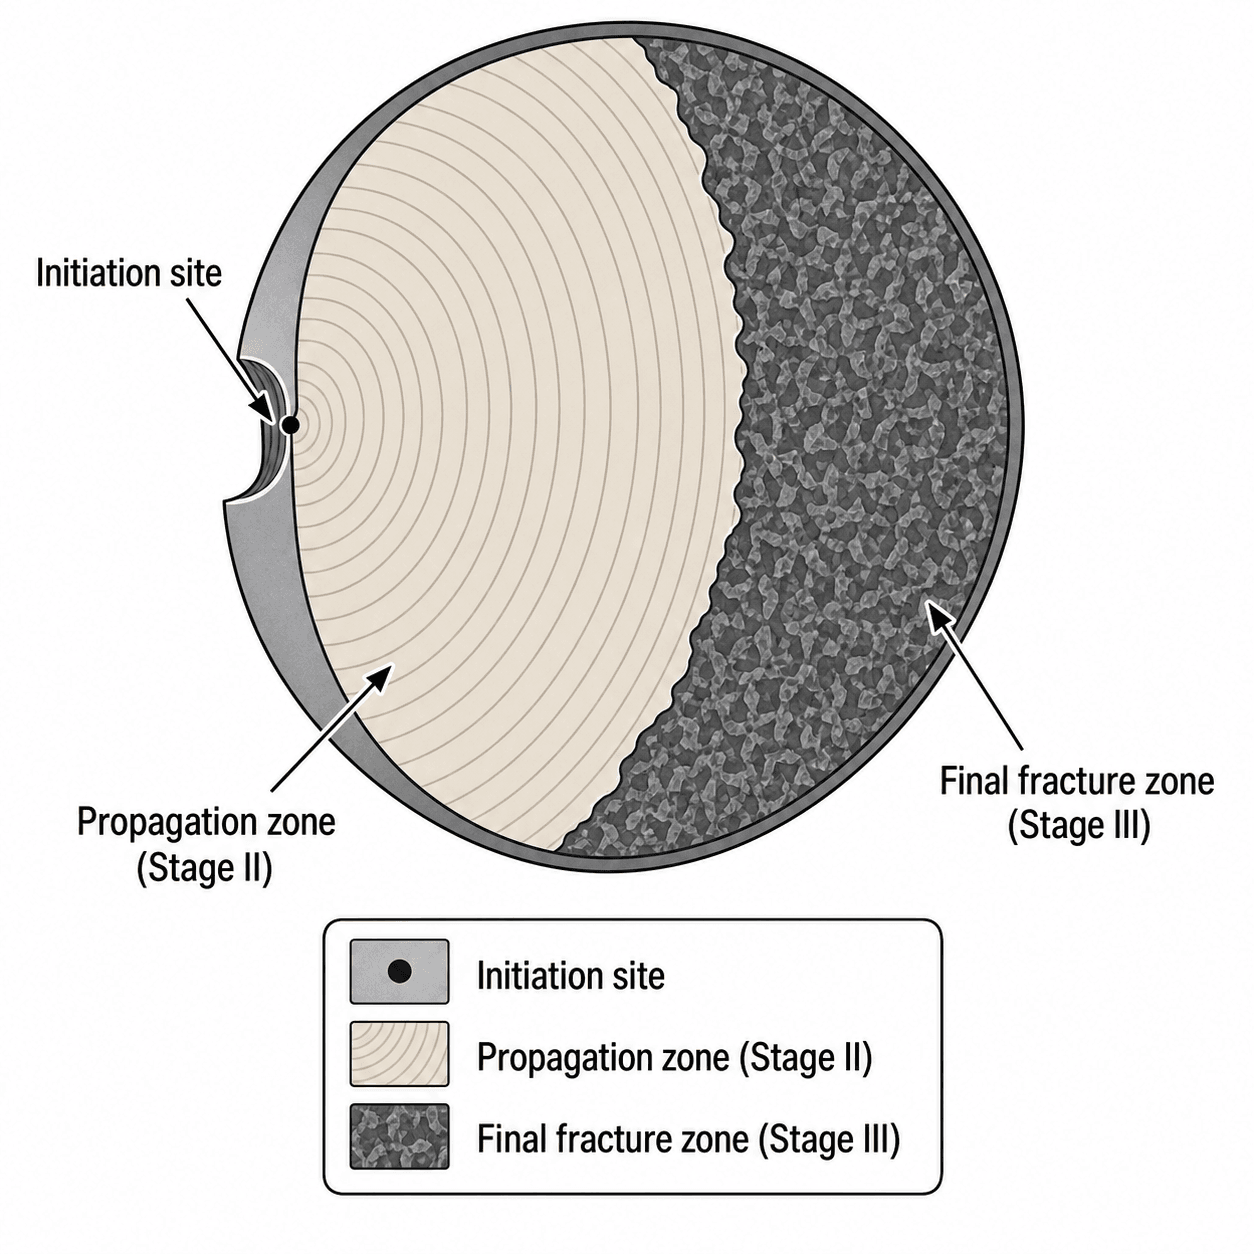
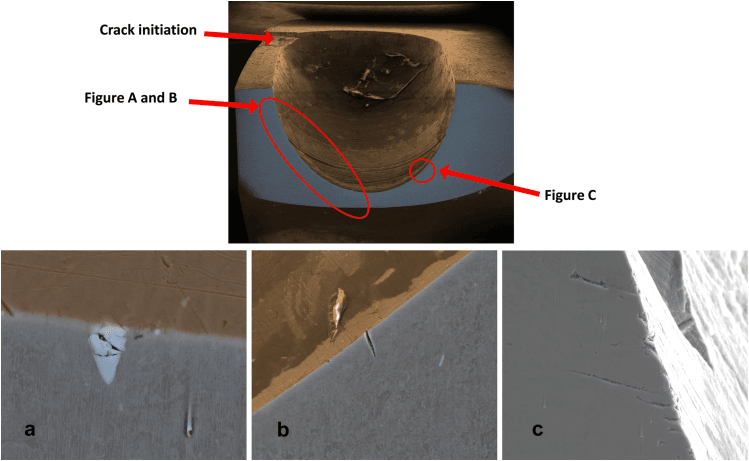
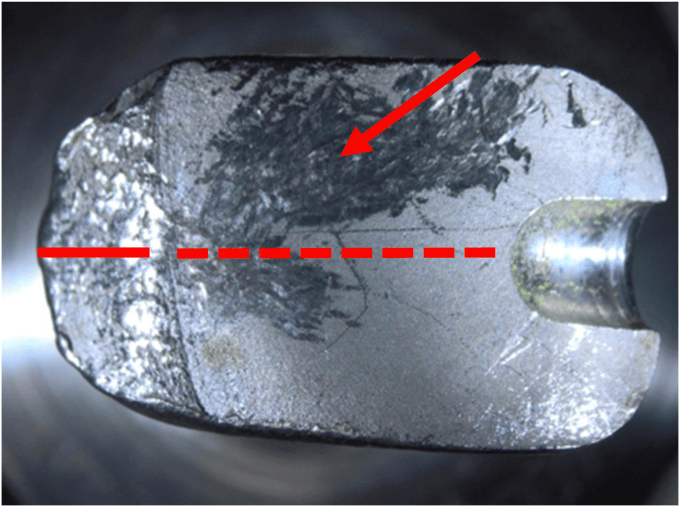
Reading the surface. A fatigue fracture leaves a characteristic, diagnosable face on the retrieved implant or in a clinical photograph, and reading it is a high-yield viva skill. The surface has three zones.
- Appearance
- A single point (or several) at a surface stress riser — notch, screw hole, machining mark, corrosion pit or inclusion
- What it tells you
- Points to the stress concentration to design out (quantified by the stress concentration factor)
- Appearance
- Smooth, with macroscopic concentric beach (clamshell) marks centred on the origin; microscopic striations within it
- What it tells you
- Stable crack growth; beach marks show rate changes/rest periods, striations show per-cycle advance
- Appearance
- Rough, granular or fibrous; dimpled if ductile, cleavage if brittle
- What it tells you
- The remnant cross-section that overloaded in one go — behaves like a static fracture
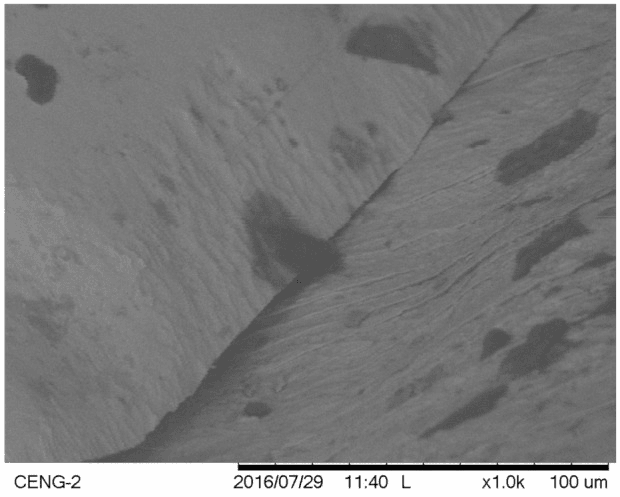
Beach marks versus striations. This is the classic trap. Beach marks (clamshell or arrest marks) are macroscopic, visible to the naked eye, and each marks a change in loading or a rest period, not one cycle. They reflect variable, real-world loading, so they are often absent on a constant-amplitude laboratory failure. Striations are microscopic, seen on electron microscopy, and in the classical model each striation represents one loading cycle: the physical record of Paris-law advance.
Reading the whole surface. Beyond identifying the zones, three features are read:
- The origin identifies the stress riser responsible
- The ratio of the smooth fatigue zone to the rough fast-fracture zone indicates the nominal stress. A large fatigue zone with a small final zone means a low applied stress over many cycles; a small fatigue zone with a large final zone means a high applied stress
- Multiple origins and ratchet marks (steps between adjacent crack fronts) indicate a high stress concentration or a high load
On a retrieved implant. This is how the Gilbert retrieval analysis (Evidence Base) identified intergranular corrosion-fatigue: scanning electron microscopy of the fracture face localised the origin to the corroded taper region.
Management Algorithm
Clinical Relevance
Where implants fail in fatigue. The common clinical scenarios:
- Plate fracture in delayed union or nonunion: the plate bears cyclic bending for months
- Screw breakage, including in spinal instrumentation: stress concentration at the threads, especially if overtightened
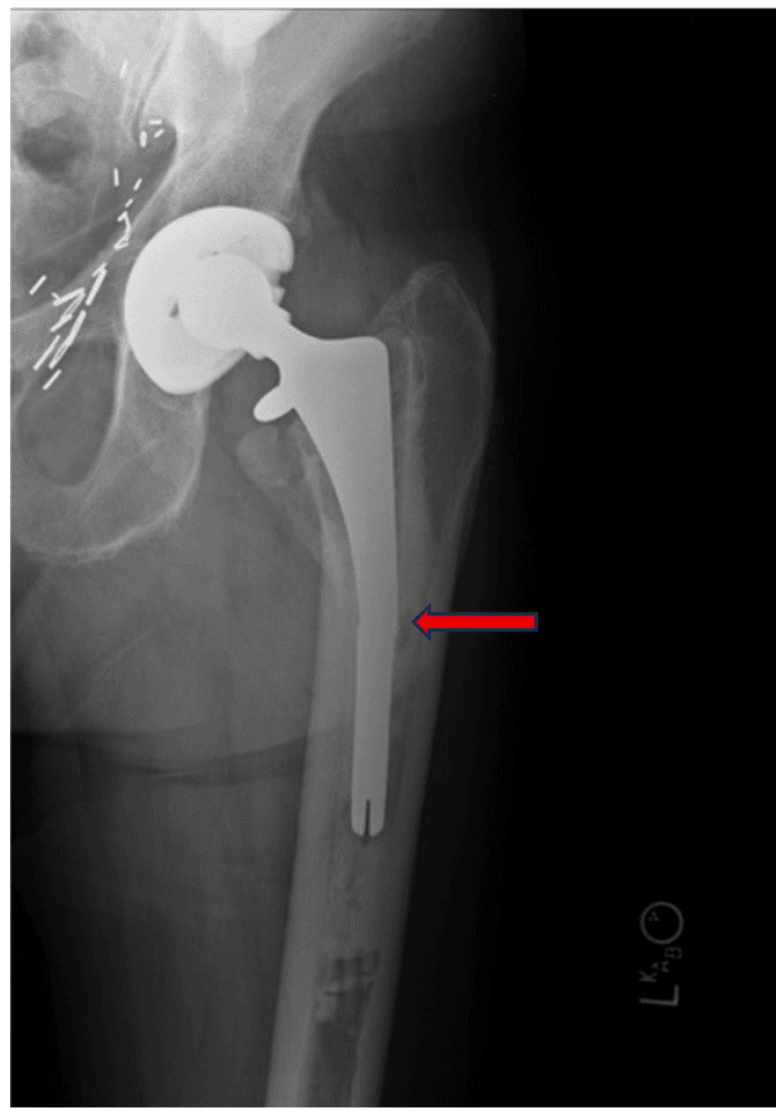
- Hip stem fracture: rare with modern designs, seen with undersized stems. Loosening changes load transfer, and the loss of support turns bending into a fatigue problem
- Tibial baseplate failure in TKA: unsupported overhang creates cantilever bending
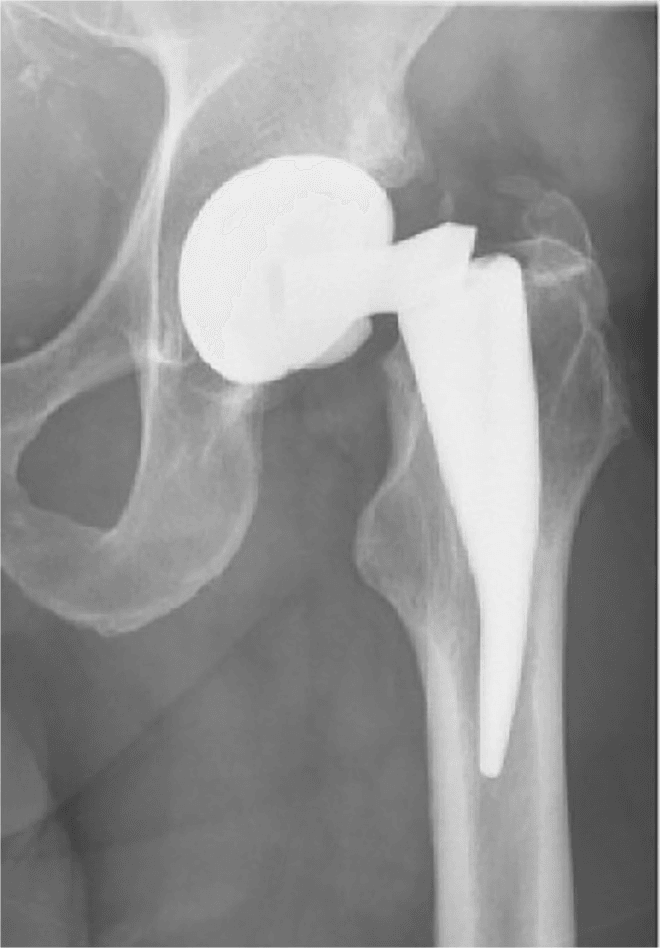
- Modular junction: taper fractures in hip stems from fretting and corrosion
Prevention. Proper implant design and early bone healing, before fatigue damage accumulates, are the defences:
- Size the implant properly and avoid undersizing
- Minimise stress concentrations: avoid sharp corners and notches
- Surface treatments: polishing, passivation
- Avoid stress shielding
- Achieve early bony union, which reduces the loading cycles on the implant
- Follow the manufacturer's guidelines and do not modify implants
Corrosion and fatigue. Corrosion dramatically reduces fatigue life, through four mechanisms:
- Fretting corrosion: micromotion creates wear particles and crevices
- Crevice corrosion: oxygen depletion in gaps accelerates oxidation
- Pitting corrosion: creates stress concentration sites for crack initiation
- Stress corrosion cracking: tensile stress combined with a corrosive environment
The modular taper. Modular taper junctions in THA are subject to fretting corrosion. Micromotion between head and stem creates debris and a crevice environment, with the potential for catastrophic taper fracture, so proper assembly (clean, dry, impaction) is critical.
Fatigue or something else? A fractured implant on a radiograph is not automatically a fatigue failure. The viva-critical skill is recognising the failure mode from the history, the surface appearance and the timing.
- Typical Trigger
- Cyclic load below yield (e.g. nonunion)
- Surface / Radiographic Clue
- Beach marks then granular final-fracture zone; often at a screw hole
- Time Course
- Months of repeated loading
- Key Discriminator
- Fracture below ultimate strength; preceding biological failure
- Typical Trigger
- Single supraphysiological load (fall, trauma)
- Surface / Radiographic Clue
- Single ductile or brittle fracture, no beach marks
- Time Course
- Instantaneous
- Key Discriminator
- Identifiable single high-energy event
- Typical Trigger
- Crevice + micromotion at modular junction
- Surface / Radiographic Clue
- Black debris, pitting; rising serum cobalt; pseudotumour
- Time Course
- Years
- Key Discriminator
- Metal-ion rise and adverse local tissue reaction
- Typical Trigger
- Bearing surface articulation
- Surface / Radiographic Clue
- Polyethylene wear, periprosthetic lucency
- Time Course
- Many years
- Key Discriminator
- Loosening from particle disease, not implant break
- Typical Trigger
- Inclusion, void, processing error
- Surface / Radiographic Clue
- Crack origin at internal flaw, atypical site
- Time Course
- Often early
- Key Discriminator
- Failure inconsistent with normal loading; recall/MDR signal
Guidelines, Registries & Global Practice
Global Epidemiology
- Implant fatigue fracture is rare with modern designs but contributes to revision burden, especially where union is delayed. Cyclic loading is universal: walking generates roughly 1 to 2.5 million gait cycles per year, so a 20-year implant must survive tens of millions of cycles.
- Fretting and corrosion at modular junctions (trunnionosis) emerged as a recognised mode of metal-ion release and component failure during the metal-on-metal and large-head era, prompting redesign and several device withdrawals worldwide.
Standards, Guidelines and Testing Frameworks (Side by Side)
- Scope
- Pre-market mechanical and fatigue test standards
- Relevance to Fatigue
- Define cyclic test loads and run-out cycles devices must survive before market
- Scope
- Fixation principles and implant design
- Relevance to Fatigue
- Stability-versus-biology balance; achieving union to offload the implant
- Scope
- Regulatory clearance and post-market surveillance
- Relevance to Fatigue
- Require fatigue testing and capture field fracture reports / recalls
- Scope
- Clinical guidance and metal-ion / MoM surveillance
- Relevance to Fatigue
- Monitoring pathways for taper corrosion and adverse reactions
Registry Evidence
- Joint registries (NJR England and Wales, AJRR USA, AOANJRR Australia, Swedish SHAR, Norwegian, NZJR) track revision causes. Pure stem fatigue fracture is uncommon, but registries flagged early failure of specific modular-neck and large-head metal-on-metal designs, providing the population signal that drove withdrawals.
- Registry data give indirect evidence of fatigue- and corrosion-related failure through device-specific revision rates and time-to-revision curves.
High- vs Limited-Resource Practice Variation
- In well-resourced settings, alloy selection, surface engineering and modular-junction surveillance (serum metal ions, cross-sectional imaging) are routine.
- In limited-resource settings, reuse of implants, off-label modification (contouring/cutting plates, which introduces stress risers) and delayed nonunion management increase fatigue-fracture risk. The universal mitigation everywhere is achieving timely union to transfer load from implant to bone.
Exam Relevance (Global)
S-N curves, endurance limit, Paris law and the clinical link to plate fracture in delayed union are core basic-science material in orthopaedic fellowship and board examinations worldwide. Material selection (titanium vs stainless steel vs cobalt-chrome) and fatigue properties are frequently examined.
Controversies and Areas of Uncertainty
Fatigue principles are well established, but several clinically important questions remain debated.
Does modularity do more harm than good? Modular necks and dual-taper stems add intra-operative flexibility but introduce extra crevice junctions vulnerable to fretting corrosion-fatigue. Several modular-neck designs have been withdrawn after high fracture and adverse-reaction rates, yet matched data on when modularity is genuinely needed remain limited.
Optimal construct stiffness. Very stiff locked constructs can suppress callus and shift cyclic load onto the implant, risking fatigue if union is delayed; constructs that are too flexible permit excess motion. The ideal working length, screw density and use of titanium versus stainless steel for a given fracture remain areas of active biomechanical debate.
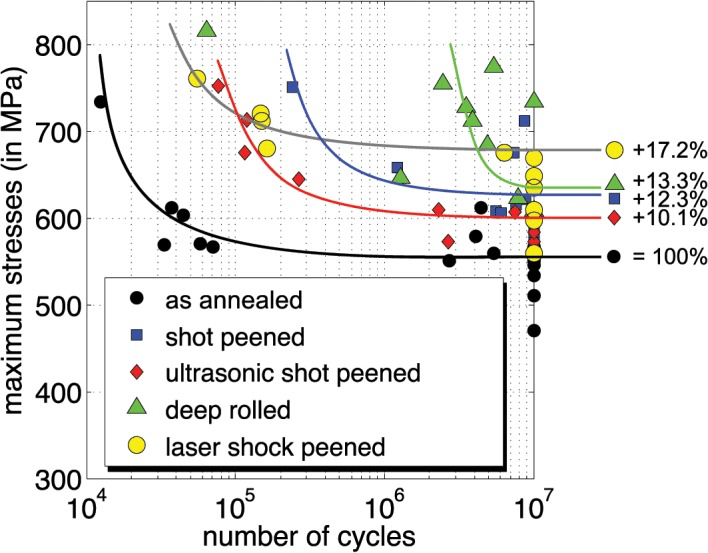
Surface treatments in practice. Shot peening and laser shock peening raise fatigue limits in the laboratory (10 to 17 percent in Ti-6Al-4V), but whether this translates into measurable reductions in clinical implant fracture or revision is not established by registry-level evidence.
Predicting individual fatigue life. Fatigue life is highly sensitive to initial defect size, patient weight and activity, so population S-N data poorly predict any single patient. There is no validated clinical tool to forecast time-to-fatigue-fracture for an individual implant in vivo.
MCQ Practice Points
Q: What does the S-N curve represent in fatigue testing? A: Stress amplitude (S) versus number of cycles to failure (N). Fundamental relationship showing that higher stress leads to fewer cycles before fatigue failure.
Q: Do titanium alloys have a true endurance limit? A: No - Unlike ferrous metals, titanium alloys have no true endurance limit. The S-N curve continues to decline beyond 10^7 cycles. A fatigue limit is defined at 10^7 cycles (~60% UTS) for design purposes.
Q: What does Paris law describe? A: Crack growth rate per cycle in Stage II fatigue: da/dN = C(ΔK)^m, where ΔK is stress intensity factor range. Describes stable crack propagation before final fracture.
Q: Why do plates fracture in delayed unions but not in normally healing fractures? A: Cyclic loading accumulates fatigue damage when bone doesn't heal. Normal healing occurs in 3-6 months (less than 1 million cycles), insufficient for fatigue failure. Delayed union subjects plate to millions of cycles, causing fatigue crack initiation and propagation.
Q: How many loading cycles must a hip replacement survive for 20-year lifespan? A: 40 million cycles - Walking generates approximately 2 million cycles per year. Design must account for 20 years × 2M cycles/year = 40M cycles with safety factor.
Exam Viva Scenarios
Practise clinical reasoning and management decisions out loud
“Examiner shows S-N curve and asks: Explain what this curve represents and the concept of endurance limit.”
“A patient with tibial shaft fracture has plate fixation. At 9 months, the fracture has not healed and you notice a crack in the plate on radiographs. Explain the fatigue failure mechanism and management.”
“A patient with a metal-on-polyethylene total hip presents 6 years post-op with new groin pain and a rising serum cobalt level. Imaging suggests a fluid collection around the neck. Explain how corrosion and fatigue interact at the modular junction and how this could progress to component fracture.”
Fatigue Fundamentals
- Failure from cyclic loading BELOW ultimate tensile strength
- S-N curve: stress (S) vs cycles to failure (N)
- High stress = low cycle fatigue; low stress = high cycle
- Walking: 2 million cycles/year; implant needs 40M+ for 20 years
Endurance Limit
- Ferrous metals (steel): TRUE endurance limit at ~30-40% UTS
- Titanium: NO true limit, fatigue limit at 10^7 cycles (~60% UTS)
- Cobalt-chrome: NO true limit, fatigue limit at 10^7 cycles
- Design must include safety factor 2-3x below fatigue limit
Three Stages of Fatigue
- Stage I: Crack initiation (surface defect, notch, stress concentration)
- Stage II: Stable propagation (Paris law: da/dN = C(ΔK)^m)
- Stage III: Final fracture (crack reaches critical size K_IC)
- Most of life spent in Stage I (initiation)
Factors Reducing Fatigue Life
- Higher stress amplitude or mean stress
- Corrosion (fretting, crevice, pitting) - accelerates significantly
- Surface roughness and notches (stress concentration)
- Tensile residual stresses (add to applied stress)
Clinical Failures
- Plate fracture: Delayed/nonunion (1M+ cycles over 6-12 months)
- Screw breakage: Stress concentration at threads
- Modular taper fracture: Fretting corrosion + cyclic loading
- Prevention: Achieve bony union early (reduce load cycles)
Evidence Base
Intergranular Corrosion-Fatigue Failure of Cobalt-Alloy Femoral Stems
- Two modular cobalt-alloy stems fractured in the neck region at 70 and 85 months, just distal to the head-neck taper
- Scanning electron microscopy showed fracture at grain boundaries from three combined factors
- Mechanism: grain-boundary porosity plus intergranular corrosive attack plus cyclic fatigue loading
- Corrosive attack was initiated both at the head-neck taper and at the free surface, penetrating deep into the microstructure
Mechanical Biocompatibilities of Titanium Alloys for Biomedical Applications
- Fatigue life, fretting-fatigue life and notch fatigue strength are core 'mechanical biocompatibility' design parameters for hard-tissue implants
- Notch and fretting conditions markedly reduce the fatigue strength of titanium alloys versus plain specimens
- Ageing and thermomechanical treatment of the alloy microstructure strongly influence fatigue strength
- Deformation-induced martensitic transformation of unstable beta phase can improve fatigue-crack-propagation resistance and ductility
Improvement of the Fatigue Life of Titanium Alloys Through Microstructural Control
- Plain, notch and fretting fatigue strengths of medical titanium alloys differ substantially and must be evaluated separately
- Heat treatment and thermomechanical processing alter microstructure and so change fatigue strength
- Surface modification is a key lever for improving fatigue performance of alpha+beta and beta-type alloys
- Fretting fatigue (relevant to modular junctions) is consistently lower than plain fatigue strength
Fatigue Performance of Medical Ti-6Al-4V After Mechanical Surface Treatments
- High-cycle fatigue tested to 10 million cycles (R = 0.1) on Ti-6Al-4V specimens
- Shot peening, deep rolling, ultrasonic shot peening and laser shock peening all introduced compressive residual stress
- Fatigue performance increased by 10% to 17.2%, with laser shock peening giving the largest gain
- Compressive residual stress is the mechanism; treatments may also improve fretting-wear resistance at modular junctions
Evolution of Internal Fixation: Stability, Biology and Implant Loading
- Flexible (splinting) fixation induces callus and reliable healing, whereas rigid constructs depend on absolute stability
- An implant carrying load across an ununited fracture is exposed to repeated cyclic loading until bone shares the load
- Strain theory defines the instability fractures tolerate and the minimum needed to induce callus
- Preserving blood supply and avoiding extensive bone contact promote prompt union and reduce time the implant bears load