Diagnostic Test Statistics
- Sensitivity/specificity are calculated DOWN the columns; PPV/NPV ACROSS the rows. Computing sensitivity across a row (the commonest 2×2 error) gives you PPV by mistake.
- PPV and NPV depend on PREVALENCE; sensitivity and specificity do not (materially). Quoting a study's PPV for your own population without considering its prevalence is the classic appraisal error - PPV collapses in low-prevalence screening.
- SnNout / SpPin: a Snsitive test, when Negative, rules out; a Specific test, when Positive, rules in. Don't invert them.
- Likelihood ratios are prevalence-INDEPENDENT - that is their advantage over predictive values. LR+ = Sn/(1−Sp), LR− = (1−Sn)/Sp; combine as pre-test odds × LR = post-test odds (not probabilities directly).
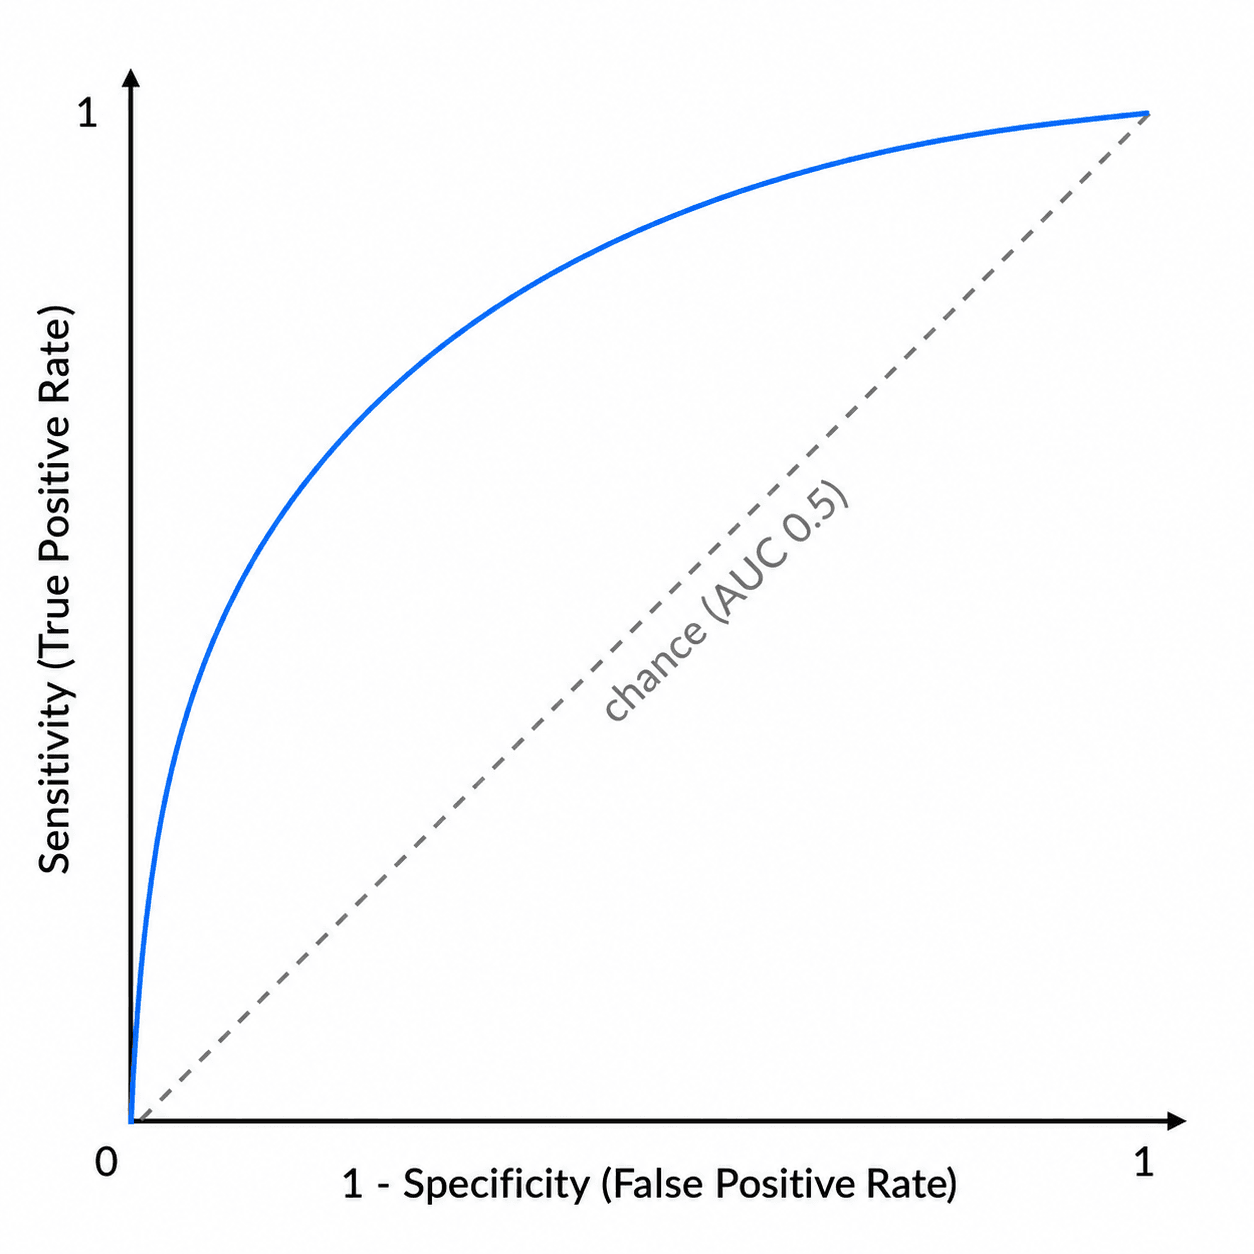
- The ROC plots sensitivity vs (1 − specificity) - not specificity. AUC 0.5 = chance, 1.0 = perfect.
- A high AUC does not mean the test is useful at every threshold - you still pick an operating point by the relative cost of a missed case vs a false alarm.
Overview & Introduction
Diagnostic-test statistics are core evidence-based-medicine / critical-appraisal material - the examiner wants to see that you can take a published test (or your own clinical sign) and say how good it is, and how to apply it to the patient in front of you. Orthopaedics is full of diagnostic tests - the Lachman and pivot-shift for the ACL, the Ottawa rules, the Thompson test, MRI for a meniscal tear - and every one of them has a sensitivity, a specificity and a behaviour that changes with the population.
- It is pure reasoning, not memory - given a 2×2 table you can derive every metric, which is why examiners love it.
- It exposes a common error: confusing test properties (sensitivity/specificity) with the patient's answer (PPV/NPV) and ignoring prevalence.
- It is clinically real: choosing a screening vs a confirmatory test, and interpreting an MRI or a clinical sign, both rest on these numbers.
- The robust numbers (likelihood ratios, AUC) are exactly what a thoughtful candidate quotes instead of a prevalence-bound PPV.
Concepts: the 2×2 table & core formulas
Every diagnostic statistic is built from a 2×2 table comparing the test result against the reference (gold) standard:
- Disease PRESENT
- True Positive (TP)
- Disease ABSENT
- False Positive (FP)
- Row total
- TP + FP → PPV
- Disease PRESENT
- False Negative (FN)
- Disease ABSENT
- True Negative (TN)
- Row total
- FN + TN → NPV
- Disease PRESENT
- TP + FN (all diseased)
- Disease ABSENT
- FP + TN (all well)
- Row total
- N
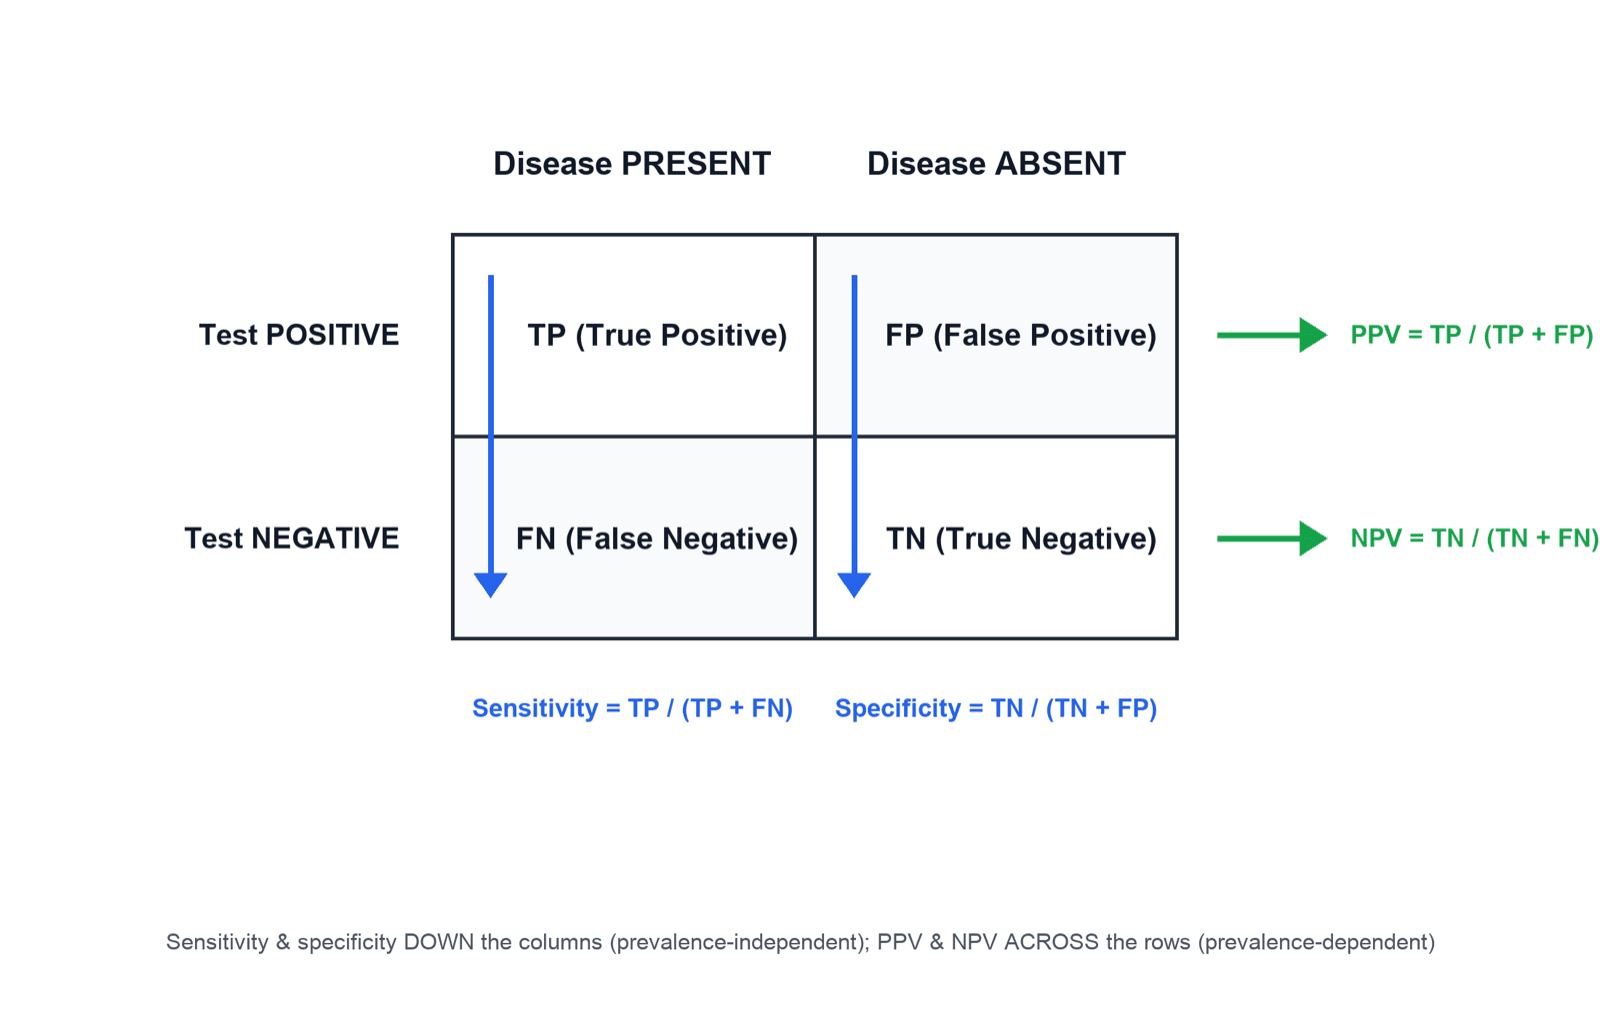
- Sensitivity = TP / (TP + FN) — of all who HAVE the disease, the fraction the test catches (down the "disease present" column).
- Specificity = TN / (TN + FP) — of all who do NOT have the disease, the fraction the test clears (down the "disease absent" column).
- Positive predictive value (PPV) = TP / (TP + FP) — of all who test POSITIVE, the fraction truly diseased (across the "test positive" row).
- Negative predictive value (NPV) = TN / (TN + FN) — of all who test NEGATIVE, the fraction truly well (across the "test negative" row).
Sensitivity and specificity are calculated DOWN the columns (within each true-disease column) — they describe the test and are largely prevalence-independent. PPV and NPV are calculated ACROSS the rows (within each test-result row) — they answer the patient's question but depend on prevalence, so they are population-specific.
Sensitivity & specificity (SnNout / SpPin)
A test with high sensitivity has few false negatives, so a NEGATIVE result reliably rules the disease OUT: SnNout. High-sensitivity tests are the screening/'safety-net' tests you want negative.
A test with high specificity has few false positives, so a POSITIVE result reliably rules the disease IN: SpPin. High-specificity tests are the confirmatory tests you trust when positive.
A meta-analysis of clinical examination for ACL rupture illustrates this perfectly. The Lachman test is highly sensitive (pooled sensitivity 85%, specificity 94%) — a good screening test you want negative (SnNout). The pivot-shift test is highly specific (specificity 98%) but insensitive (sensitivity 24%) — so a positive pivot shift effectively rules ACL rupture IN (SpPin), but a negative one does not rule it out. The anterior drawer performs well in chronic injury (sensitivity 92%, specificity 91%) but poorly when acute. Hence the recommendation: perform the Lachman test (to screen) and the pivot shift (to confirm).
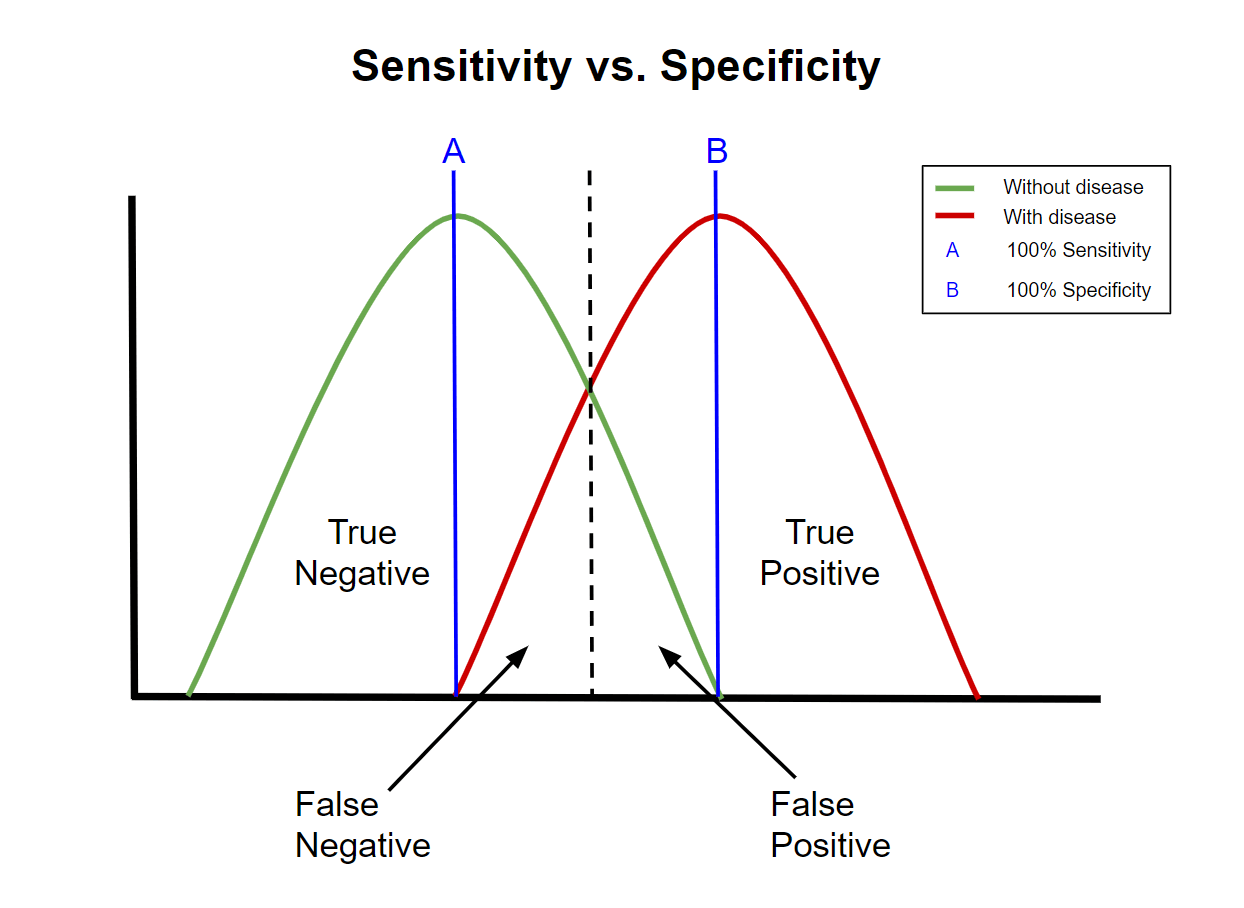
For a test read on a continuous scale, moving the cut-off trades sensitivity against specificity: lowering the threshold catches more true positives (higher sensitivity) but creates more false positives (lower specificity), and vice versa. There is no free lunch — the ROC curve displays this entire trade-off. The "best" threshold depends on the cost of a missed case versus a false alarm.
Predictive values & prevalence
Sensitivity and specificity are properties of the test; predictive values are properties of the test applied to a particular population. As prevalence (pre-test probability) falls, the pool of truly diseased people shrinks relative to the well, so even a small false-positive rate generates many false positives — and PPV falls (while NPV rises). The identical test therefore has a high PPV in a high-prevalence (specialist clinic) setting and a low PPV in a low-prevalence (population screening) setting. This is the single most important caveat when applying published test data to your own patients.
- Pre-test probability (prevalence)
- Low
- Effect on PPV
- PPV LOW (many false positives)
- Effect on NPV
- NPV high
- Pre-test probability (prevalence)
- Moderate–high
- Effect on PPV
- PPV higher
- Effect on NPV
- NPV lower
- Pre-test probability (prevalence)
- High
- Effect on PPV
- PPV HIGH
- Effect on NPV
- NPV lower
Likelihood ratios & post-test probability
Likelihood ratios (LRs) combine sensitivity and specificity into a single number that tells you how much a given result changes the odds of disease — and, unlike predictive values, they are independent of prevalence:
- LR+ = sensitivity / (1 − specificity) — how much MORE likely a positive result is in disease than in health.
- LR− = (1 − sensitivity) / specificity — how much LESS likely a negative result makes disease.
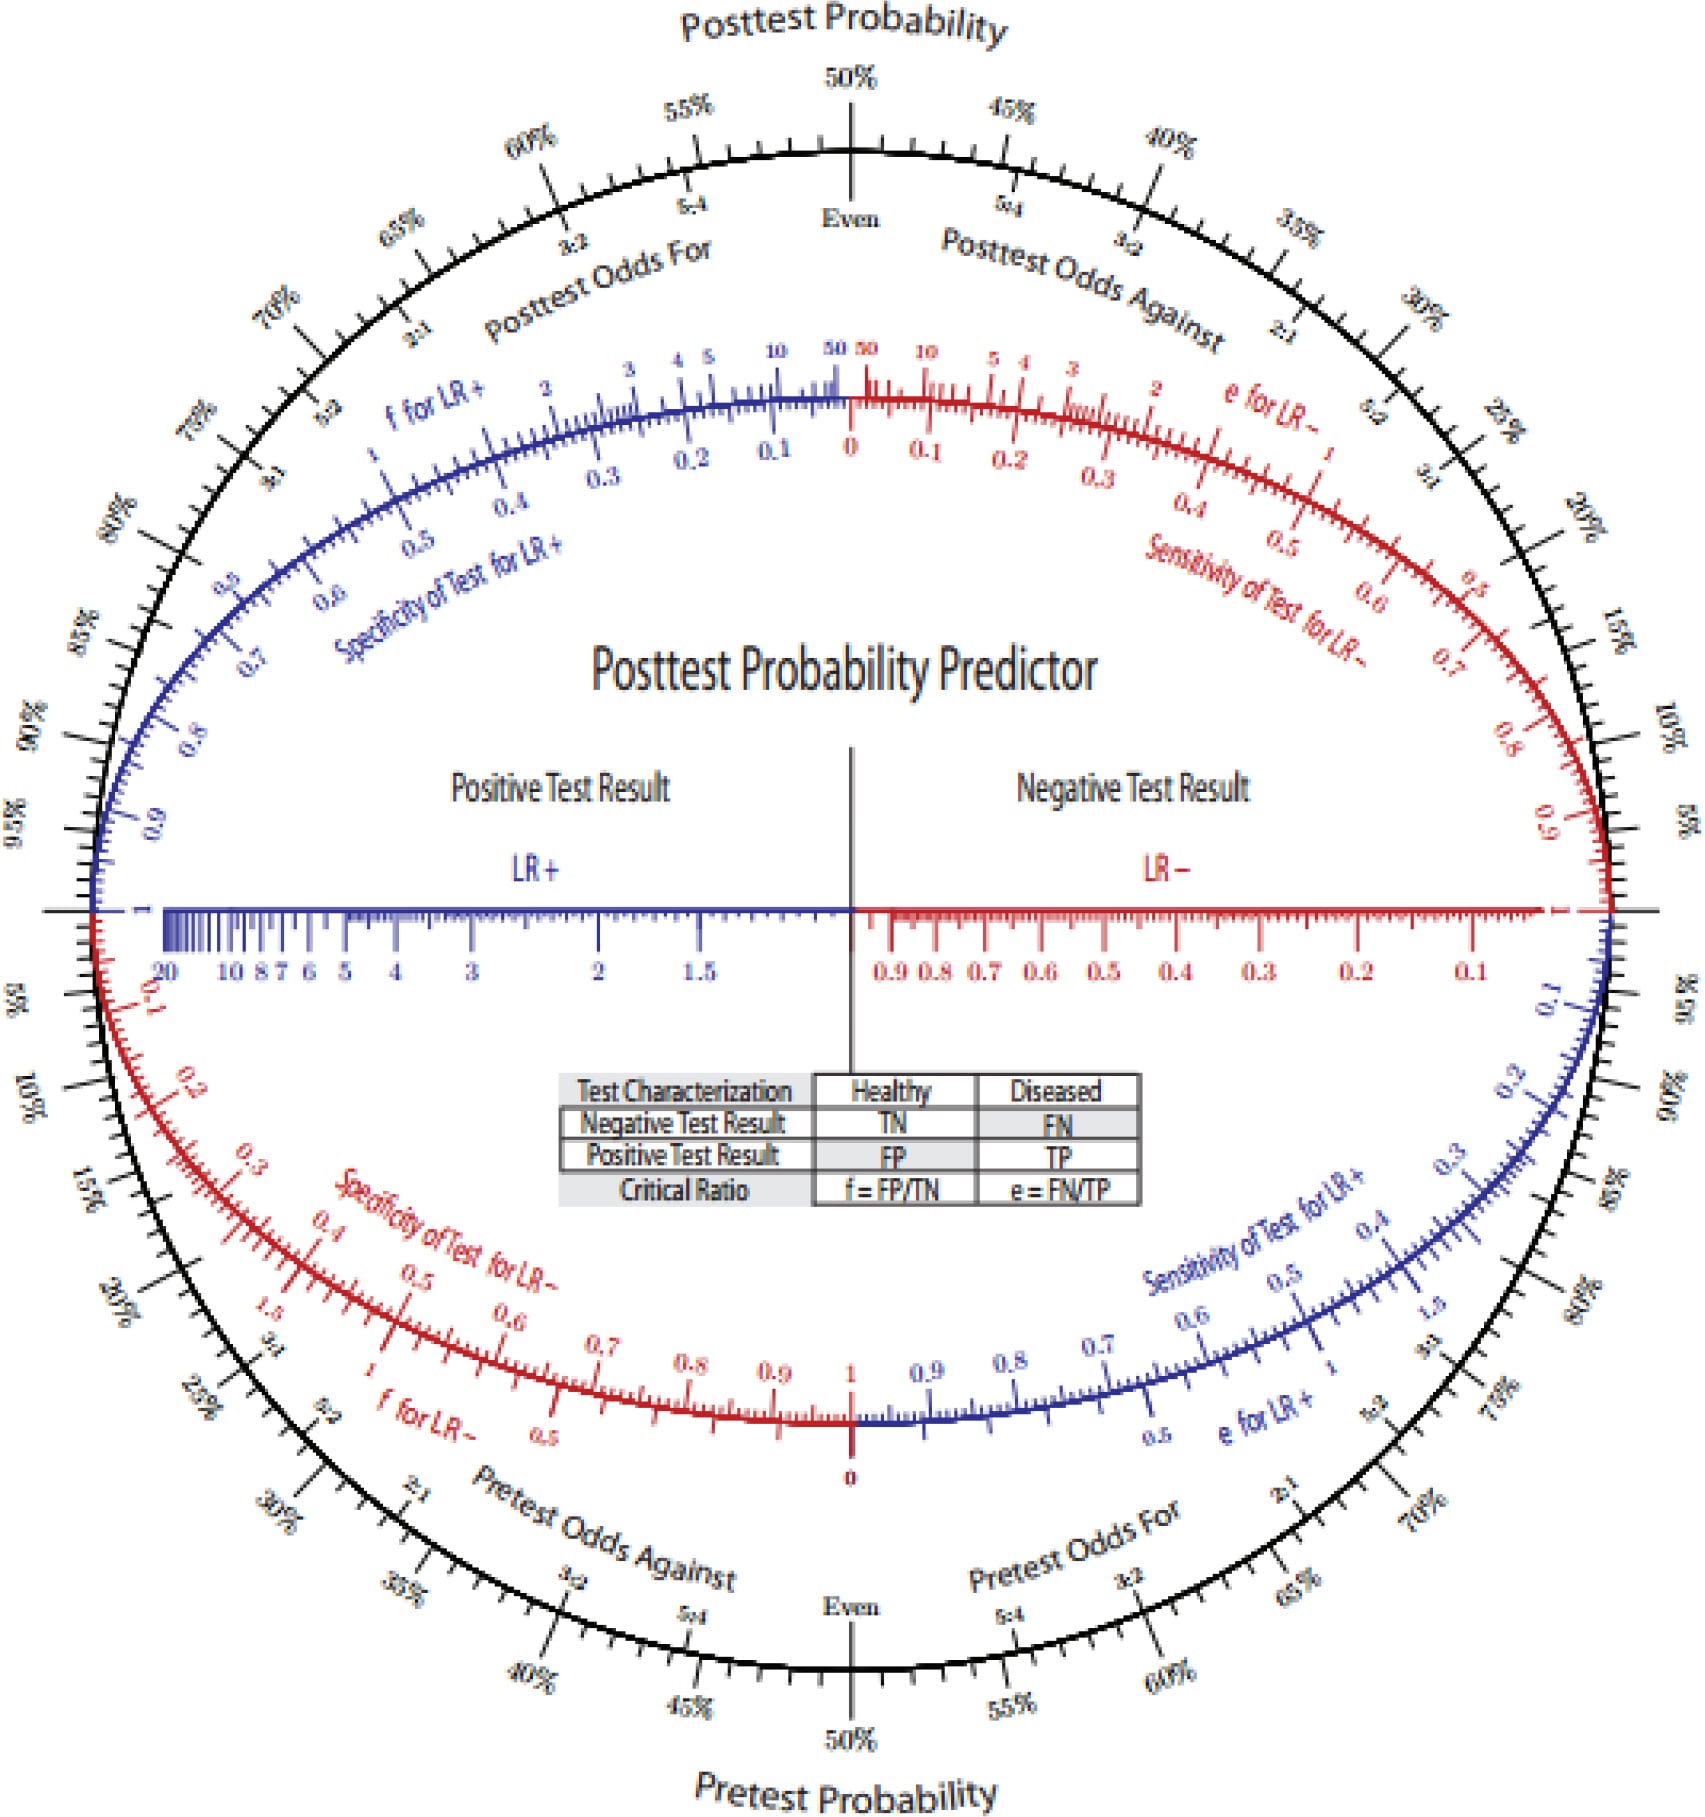
Apply them as: pre-test odds × LR = post-test odds (convert probability to odds, multiply, convert back; a Fagan nomogram does this graphically).
- LR−
- Less than 0.1
- Effect on probability of disease
- Large, often conclusive change
- LR−
- 0.1 to 0.2
- Effect on probability of disease
- Moderate change
- LR−
- 0.2 to 0.5
- Effect on probability of disease
- Small change
- LR−
- 0.5 to 1
- Effect on probability of disease
- Minimal / rarely important change
- LR−
- 1
- Effect on probability of disease
- No change (test useless at that result)
Using the Lachman data (sensitivity 85%, specificity 94%): LR+ = 0.85 / (1 − 0.94) = 0.85 / 0.06 ≈ 14 (a positive Lachman strongly raises the probability of ACL rupture), and LR− = (1 − 0.85) / 0.94 = 0.15 / 0.94 ≈ 0.16 (a negative Lachman meaningfully lowers it). The high LR+ explains why a positive Lachman is so persuasive.
The ROC curve & AUC
For a test measured on a continuous (or ordinal) scale, the ROC curve plots sensitivity (true positive rate) on the y-axis against 1 − specificity (false positive rate) on the x-axis as the threshold is varied across its full range. A test with no discriminating ability follows the diagonal (line of chance); a good test bows toward the top-left corner. The area under the curve (AUC) summarises overall discrimination in a single number.
- Discrimination
- No better than chance
- Discrimination
- Acceptable
- Discrimination
- Excellent
- Discrimination
- Outstanding
- Discrimination
- Perfect separation
The ROC curve makes the threshold-independent performance of a test visible and lets you compare two tests (the larger AUC discriminates better overall) and choose an operating point that balances the costs of false negatives and false positives for your clinical question.
Overall accuracy = (TP + TN) / N is the most intuitive summary but is misleading in imbalanced populations - the accuracy paradox: in low-prevalence disease a test (or a clinician) that simply calls everyone negative scores a high accuracy yet is clinically useless. That is exactly why sensitivity, specificity and likelihood ratios are preferred over raw accuracy. To pick the operating point, the Youden index (J = sensitivity + specificity − 1, ranging 0 for a useless test to 1 for a perfect one) identifies the optimal ROC threshold - the point that maximises Sn + Sp, i.e. the point on the curve furthest above the chance diagonal - when false positives and false negatives are weighted equally. Shift the chosen point away from the Youden optimum when the costs are asymmetric (favour sensitivity when missing the disease is dangerous).
Clinical Relevance: applying the numbers at the bedside
These statistics are not an academic exercise - they change how you choose, sequence and interpret the tests you use every day.
- The statistic that answers it
- A highly SENSITIVE test, when negative (SnNout)
- Orthopaedic example
- Lachman (sens 85%) to screen for ACL rupture; Ottawa ankle rules to exclude fracture
- The statistic that answers it
- A highly SPECIFIC test, when positive (SpPin)
- Orthopaedic example
- Pivot shift (spec 98%) to confirm ACL rupture
- The statistic that answers it
- PPV/NPV - but adjust for the patient's prevalence/pre-test probability
- Orthopaedic example
- A positive screening test in a low-risk clinic has a far lower PPV than in a specialist referral
- The statistic that answers it
- Likelihood ratios (prevalence-independent); pre-test odds x LR
- Orthopaedic example
- A positive Lachman (LR+ ~14) is near-conclusive; a borderline sign (LR ~1) is not
- The statistic that answers it
- ROC / AUC and choice of operating point
- Orthopaedic example
- Comparing an MRI sequence or a clinical sign by AUC
Sequence tests deliberately: screen with a sensitive test (you want a negative to be trustworthy), then confirm with a specific test (you want a positive to be trustworthy). Always anchor on the pre-test probability of the patient in front of you - the same positive result means different things in a 5%-prevalence and a 60%-prevalence population. Quote likelihood ratios rather than a borrowed PPV when you can, because they travel between populations.
A sophisticated caveat: sensitivity and specificity are "intrinsic" but not immutable - they shift with the spectrum of patients studied (spectrum bias). Sensitivity looks higher when the diseased group is severe/advanced, and specificity looks higher when the non-diseased controls are clearly well rather than symptomatic mimics - so a test validated in a tertiary cohort can underperform in primary care. Published estimates are further threatened by verification (work-up) bias - applying the gold standard only to test-positives inflates sensitivity and deflates specificity - by an imperfect or absent reference standard, and by review bias when the index and reference tests are interpreted with knowledge of each other. The standard tool for appraising these risks in a diagnostic-accuracy study is QUADAS-2 (patient selection, index test, reference standard, flow and timing). So before transplanting a study's numbers to your patient, check that its spectrum and methodology resemble your setting.
Mnemonics & Memory Aids
- Build the 2×2 (rows = test result, columns = true disease status; TP/FP/FN/TN).
- Sn = TP/(TP+FN), Sp = TN/(TN+FP) — down the columns, prevalence-independent.
- PPV = TP/(TP+FP), NPV = TN/(TN+FN) — across the rows, prevalence-DEPENDENT (PPV falls as prevalence falls).
- SnNout / SpPin — sensitive+negative rules out; specific+positive rules in.
- LR+ = Sn/(1−Sp), LR− = (1−Sn)/Sp — prevalence-independent; pre-test odds × LR = post-test odds.
- ROC = Sn vs 1−Sp across thresholds; AUC 0.5 chance → 1.0 perfect.
SnNout / SpPinThe two rules
Hook:SnNout and SpPin: sensitive-negative rules out, specific-positive rules in.
COLUMNSReading the table
Hook:Read sensitivity/specificity down the COLUMNS, predictive values across the rows.
Evidence Base
Clinical diagnosis of an anterior cruciate ligament rupture: a meta-analysis
- Pooled across 28 studies: the Lachman test had sensitivity 85% (95% CI 83-87) and specificity 94% (92-95) - a strong screening test (SnNout).
- The pivot-shift test was highly specific (98%, 96-99) but insensitive (24%, 21-27) - a confirmatory test (SpPin); the anterior drawer performed well in chronic (92%/91%) but not acute injury.
- Recommends performing both the Lachman (to screen) and the pivot shift (to confirm) - the SnNout/SpPin principle in practice.
Diagnostic tests 4: likelihood ratios
- Standard methodological reference defining the likelihood ratio and how it links pre-test and post-test probability.
- LR+ = sensitivity / (1 - specificity); LR- = (1 - sensitivity) / specificity; applied as pre-test odds x LR = post-test odds.
- Likelihood ratios are independent of prevalence - their key advantage over predictive values - and can be applied with a Fagan nomogram.
Determining Risk of Falls in Community Dwelling Older Adults: A Systematic Review and Meta-analysis Using Posttest Probability
- Calculated sensitivity, specificity, likelihood ratios and post-test probability for many fall-risk measures - a worked demonstration of applying these statistics to real clinical tests.
- No single test had strong post-test probability; cumulative (combined) measures performed better - illustrating how likelihood ratios chain from pre-test to post-test probability.
- The best-supported functional measures were the Timed Up and Go (12 s or more), the Berg Balance Scale (50 or less) and the 5-times sit-to-stand (12 s or more).
The orthopaedic test-performance figures used as worked examples (Lachman, pivot shift, anterior drawer) come from Benjaminse et al. 2006 (DOI); the likelihood-ratio method from Deeks & Altman 2004 (DOI); and a worked likelihood-ratio/post-test-probability application from Lusardi et al. 2017 (DOI). The formulas and definitions are standard biostatistics presented as mathematical relationships rather than empirical claims.