RR, OR, NNT, Effect Size & Confidence Intervals
- RELATIVE RISK (risk ratio, RR) = risk in the exposed/treated group divided by risk in the control group - the natural measure from a COHORT study or RCT. RR = 1 means no effect, less than 1 protective, greater than 1 harmful.
- ODDS RATIO (OR) = the odds of the outcome with exposure divided by the odds without - the measure derived from CASE-CONTROL studies and from logistic regression. The OR APPROXIMATES the RR when the outcome is RARE, but OVERSTATES the RR (further from 1) when the outcome is common.
- ABSOLUTE RISK REDUCTION (ARR) = control event rate minus treatment event rate; RELATIVE RISK REDUCTION (RRR) = ARR/control rate = 1 - RR. RRR can look impressive while the ARR (and clinical benefit) is small if the baseline risk is low.
- NUMBER NEEDED TO TREAT (NNT) = 1/ARR - the number of patients you must treat to prevent one additional bad outcome (round UP); the analogous harm metric is the number needed to HARM (NNH = 1/absolute risk increase).
- For TIME-TO-EVENT data use the HAZARD RATIO (HR); for CONTINUOUS outcomes use an EFFECT SIZE such as the mean difference (or standardised mean difference / Cohen's d, where ~0.2 small, ~0.5 medium, ~0.8 large).
- Every point estimate needs a CONFIDENCE INTERVAL: for a RATIO measure (RR/OR/HR) a 95% CI that CROSSES 1 is non-significant; for a DIFFERENCE measure (ARR, mean difference) the no-effect value is 0. The CI also shows PRECISION (narrow = precise).
- “RR comes from cohort/RCT; OR is the case-control measure - and OR approximates RR only when the outcome is rare.
- “Beware a big RELATIVE risk reduction with a tiny ABSOLUTE one - always ask for the ARR/NNT to judge real-world benefit.
- “A ratio measure (RR/OR/HR) whose 95% CI crosses 1 is not statistically significant; for ARR/mean difference the null value is 0.
Ratios of risk/odds. Good for strength of association, but a relative figure hides the baseline risk - a 50% RRR means little if the event is very rare.
The actual difference in event rates. Reflects real-world magnitude of benefit and depends on baseline risk.
1/ARR - the most clinically intuitive measure: how many patients you treat to prevent one event. Lower NNT = bigger effect.
Relative Risk & Odds Ratio
Both express how much an exposure/treatment changes the chance of an outcome, but they are computed differently and arise from different designs:
- Relative risk (RR) = (risk in exposed) / (risk in unexposed), where risk = events/total in that group. RR is the natural measure of a cohort study or RCT, where you can measure true incidence.
- Odds ratio (OR) = (odds in exposed) / (odds in unexposed), where odds = events/non-events. OR is the measure of a case-control study (where incidence cannot be measured) and of logistic regression.
For both, 1 = no effect, less than 1 = protective, greater than 1 = increased risk. The OR approximates the RR when the outcome is rare; when the outcome is common, the OR is further from 1 than the RR and can exaggerate the apparent effect.
A meta-analysis of intravenous tranexamic acid in revision joint arthroplasty reported the odds of needing a blood transfusion as OR = 0.20 (95% CI 0.11-0.34) with TXA versus control - i.e. roughly an 80% reduction in the odds of transfusion, and the confidence interval lies entirely below 1, so the effect is statistically significant. By contrast the OR for venous thromboembolism was 0.57 (95% CI 0.13-2.42) - the CI crosses 1, so that difference is not significant. This shows how the point estimate and its CI together convey both direction/size and significance.
Absolute Measures, RRR & NNT
| 0 | 1 | 2 |
|---|---|---|
| Control event rate (CER) | events / total (control) | Baseline risk |
| Experimental event rate (EER) | events / total (treated) | Risk on treatment |
| Absolute risk reduction (ARR) | CER - EER | Real difference in risk |
| Relative risk reduction (RRR) | ARR / CER = 1 - RR | Proportional reduction (hides baseline) |
| Number needed to treat (NNT) | 1 / ARR (round up) | Patients treated to prevent one event |
| Number needed to harm (NNH) | 1 / absolute risk increase | Patients treated to cause one harm |
A relative risk reduction can sound dramatic while the absolute benefit is tiny. If a treatment cuts risk from 2% to 1%, the RRR is 50% but the ARR is only 1%, giving an NNT of 100 (treat 100 patients to prevent one event). The same 50% RRR applied to a baseline of 40% to 20% gives an ARR of 20% and an NNT of 5. Always pair the relative figure with the absolute one to judge real clinical value - and weigh NNT against the NNH for adverse effects.
Hazard Ratio, Effect Size & Confidence Intervals
For survival / time-to-event outcomes (e.g. time to implant revision), the hazard ratio (HR) compares the instantaneous event rate between groups over follow-up (from Cox regression / Kaplan- Meier). Interpreted like other ratios: HR = 1 no difference, less than 1 lower hazard, greater than 1 higher hazard. It uses the timing of events, not just whether they occurred.
Evidence & Key Studies
Intravenous tranexamic acid use in revision total joint arthroplasty: a meta-analysis
- Across 7 studies (930 patients), intravenous TXA significantly reduced the odds of transfusion in revision arthroplasty: OR 0.20 (95% CI 0.11-0.34) - the CI entirely below 1, so significant.
- VTE risk did not differ significantly: OR 0.57 (95% CI 0.13-2.42) - the CI crosses 1, so non-significant - a clean illustration of interpreting odds ratios and confidence intervals.
- Also reports mean differences (continuous effect sizes) for haemoglobin drop and RBC units transfused.
Platelet-rich plasma versus hyaluronic acid for knee osteoarthritis: a systematic review and meta-analysis of randomized controlled trials
- Reports a continuous effect-size comparison: mean WOMAC improvement 44.7% (PRP) versus 12.6% (HA) - a between-group difference rather than a ratio measure.
- Illustrates that for continuous outcomes the magnitude (mean difference/effect size) is the key effect measure, complementing significance testing.
- Demonstrates how effect measures are reported alongside p-values in orthopaedic level-1 evidence.
According to PubMed, the odds-ratio/confidence-interval worked example comes from the cited TXA meta-analysis and the continuous effect-size example from the cited PRP meta-analysis. The formulas and definitions (RR, OR, ARR, RRR, NNT, HR, Cohen's d) are standard biostatistics presented as mathematical relationships. (See also our Diagnostic Test Statistics and Study Design topics.)
Clinical Decision Scenarios
Practise clinical reasoning and management decisions out loud
“What is the difference between relative risk and odds ratio, and when is each used? When does the odds ratio mislead?”
“A trial reports a 50% relative risk reduction with a new treatment. Why might that be misleading, and how do absolute risk reduction and number needed to treat help?”
Mnemonics & Memory Aids
RATIO
Hook:RATIO: RR for risk, OR for odds, both null at 1, CI tells significance.
ARR-NNT
Hook:ARR drives NNT (1/ARR); a big RRR with a tiny ARR means a huge NNT.
Ratio measures
- RR = risk ratio (cohort/RCT); OR = odds ratio (case-control/logistic)
- 1 = no effect; below 1 protective; above 1 harmful
- OR ≈ RR only when outcome rare; CI crossing 1 = non-significant
Absolute & NNT
- ARR = CER - EER; RRR = ARR/CER = 1 - RR
- NNT = 1/ARR (round up); NNH = 1/ARI
- Big RRR + small ARR = large NNT (baseline-dependent)
Other effect measures
- Hazard ratio (HR) for time-to-event (survival)
- Mean difference / Cohen's d (0.2/0.5/0.8 = small/medium/large) for continuous
- Compare with MCID for clinical meaning
Confidence intervals
- Ratio measures null = 1; difference measures null = 0
- CI includes null -> non-significant; narrow CI -> precise
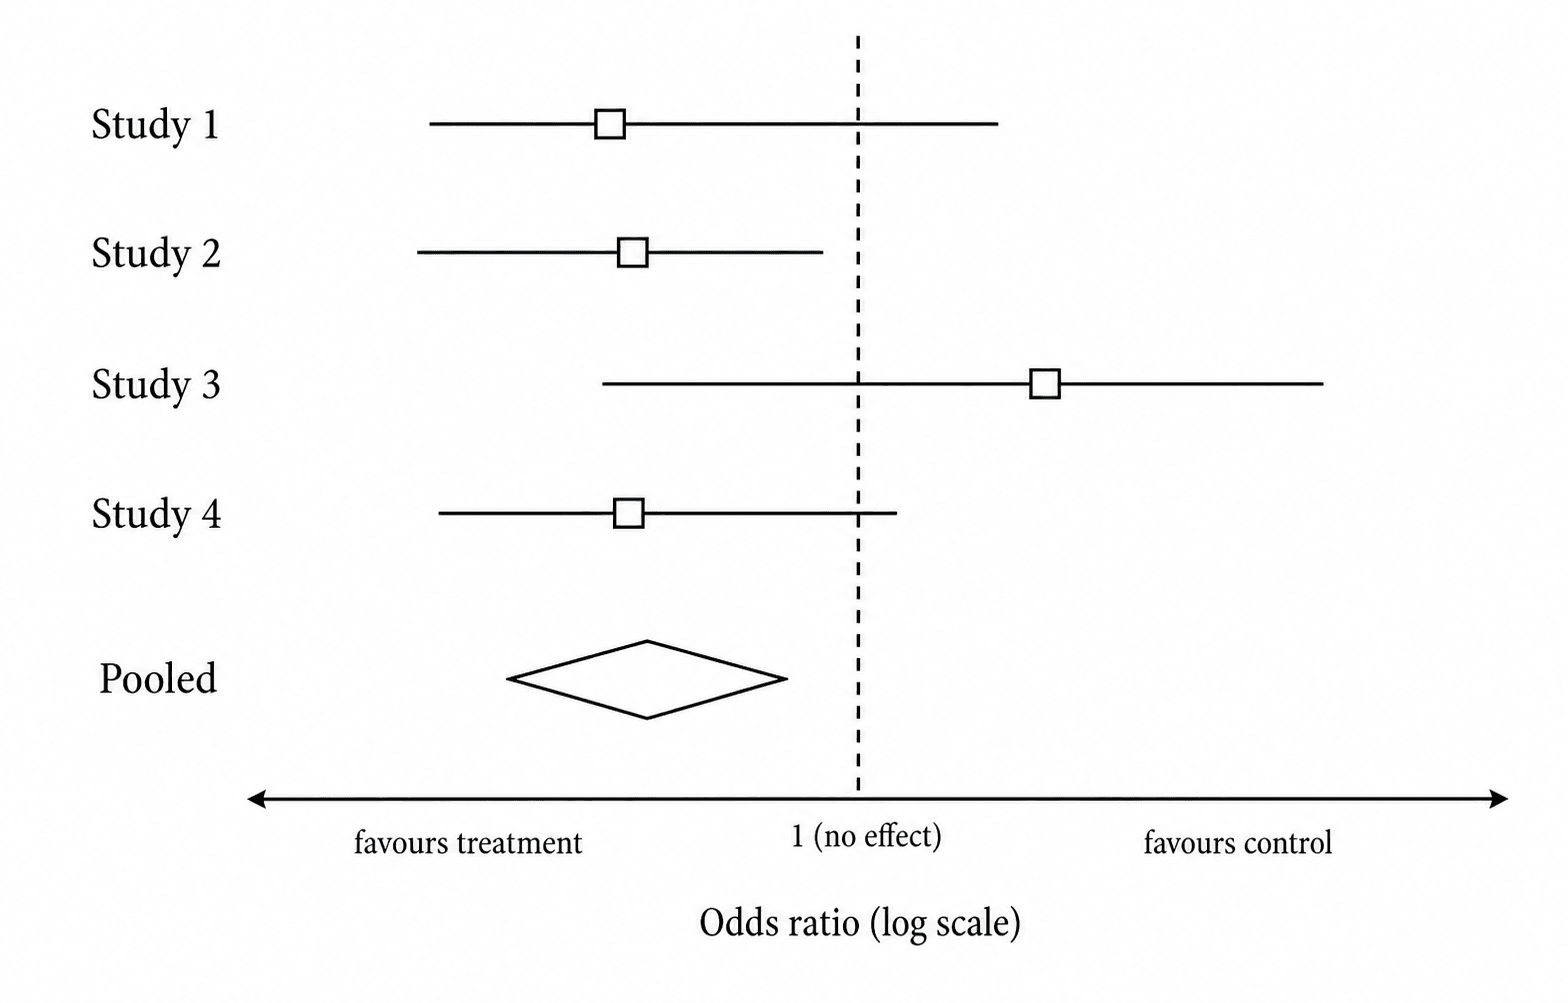
- CI more informative than a bare p-value; shown on a forest plot