Study Planning | Adequate Sampling | Effect Detection
- Power: Probability of detecting a true effect (1 minus Beta). Conventional target is 80 percent.
- Sample Size Calculation Requires: Effect size (MCID), Alpha (usually 0.05), Power (usually 0.80), Variability (SD)
- Effect Size: The magnitude of difference you want to detect - must be clinically meaningful (MCID), not just statistically significant
- Underpowered Studies: Risk Type II error (false negative) - failing to detect real treatment effect
- Factors Increasing Sample Size: Smaller effect size, higher power, higher variability, lower alpha
- “Power = 80% means 20% chance of Type II error (missing a true effect)
- “MCID (Minimal Clinically Important Difference) defines what effect size matters to patients
- “Larger sample size increases power but also increases cost and time
- “Pilot studies help estimate variability (SD) for sample size calculations
Overview
What power is. Statistical power is the probability that a study will detect an effect when there truly is an effect to detect: the probability of correctly rejecting the null hypothesis when the alternative is true. It is written as 1 minus beta, beta being the Type II error rate. A study with 80% power has an 80% chance of detecting a real effect and a 20% chance of missing it.
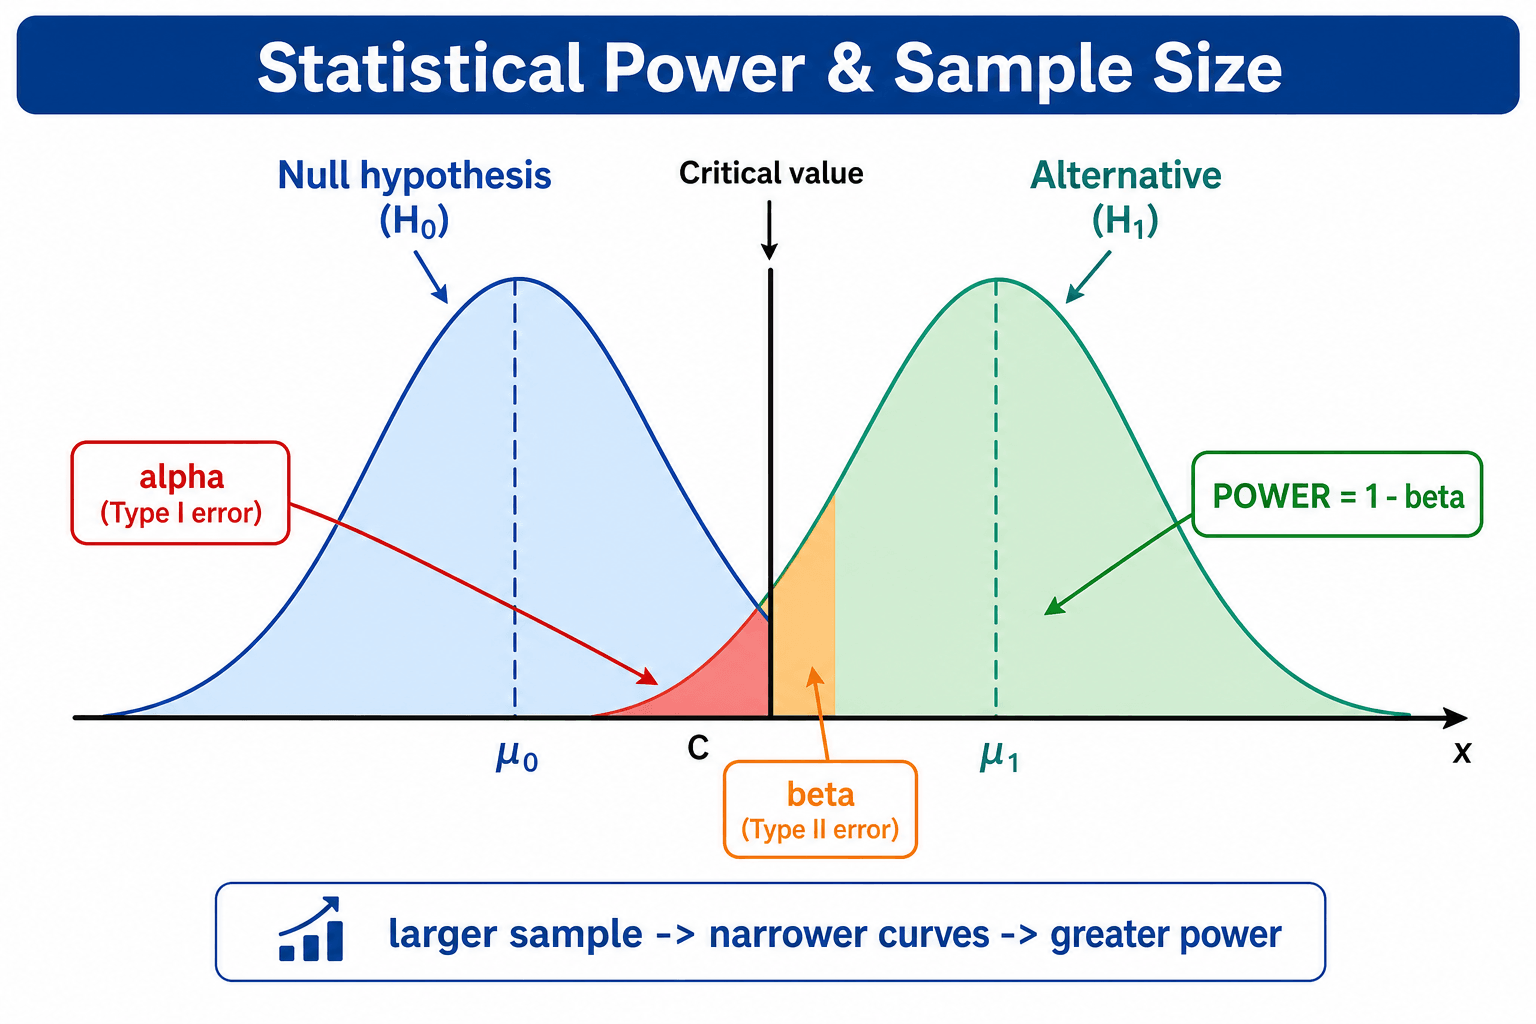
Reading a power level. At 50% a study is a coin flip, as likely to miss the effect as to find it. The conventional band is 80-90%; going higher buys a very high chance of detection at the price of a much larger sample.
- Meaning
- Very high chance of detecting true effect
- Adequacy
- Excellent but may be excessive
- Sample Size
- Very large sample needed
- Meaning
- High chance of detecting true effect
- Adequacy
- Conventional and adequate
- Sample Size
- Moderate sample size
- Meaning
- Moderate chance, meaningful risk of missing effect
- Adequacy
- Underpowered - risky
- Sample Size
- Smaller sample
- Meaning
- More likely to miss effect than find it
- Adequacy
- Severely underpowered
- Sample Size
- Very small sample
Principles of Power Analysis
Power and sample size. A larger sample increases power, but with diminishing returns. Power increases steeply at first and then plateaus, so doubling the sample does not double power.
What moves power. Power rises with the sample size, with the size of the effect being sought and with alpha, and falls as the variability of the outcome (its SD) rises.
The trade-offs. Every margin of safety is paid for in patients. Higher power requires a larger sample, with more cost and time. A smaller target effect (more clinically conservative) and a lower alpha (more statistically conservative) each require a larger sample too.
Sample Size Calculation
Every sample size calculation requires four inputs: alpha, power, the effect size and the variability of the outcome.
Alpha. The Type I error rate, the probability of falsely rejecting the null hypothesis: a false positive. The conventional choice is 0.05, accepting a 5% chance of finding a difference when none exists. A lower alpha such as 0.01 reduces false positives but requires a larger sample. When multiple outcomes are tested, the Bonferroni correction divides alpha by the number of tests to maintain the overall Type I error rate.
Power. Conventionally 0.80, an 80% chance of finding the effect if it exists and a 20% risk of missing it. A power of 0.90 is more conservative and needs a larger sample; it is used when the consequences of missing an effect are serious. Setting adequate power prevents underpowered studies that waste resources.
Effect size. The magnitude of difference the study sets out to detect. It should be clinically meaningful, not just statistically detectable, which is why it is set at the minimal clinically important difference (MCID): the smallest change that patients perceive as beneficial. Smaller effect sizes require much larger samples to detect.
Published MCIDs. Use validated values from the literature:
- WOMAC: approximately 10 points (100-point scale)
- VAS pain: approximately 15-20 mm (100-mm scale)
- SF-36 PCS: approximately 5 points
- Oxford Knee Score: 5 points
- Harris Hip Score: 10 points
- DASH: 10-15 points
Variability. The standard deviation, the spread of outcome values in the population, estimated from a pilot study, from published literature on the same outcome measure, or from prior studies in a similar population. Higher variability requires a larger sample to detect the same effect: if WOMAC scores vary widely (SD 20), more patients are needed than if they are consistent (SD 10).
APESSample Size Calculation Inputs
Hook:APES calculate sample size - Alpha, Power, Effect, SD are the four essentials!
Performing Sample Size Calculation
The formula. For comparing means between two groups with a continuous outcome, the sample size per group is
n = 2 × (Zα + Zβ)² × SD² / MCID²
where Zα and Zβ are the Z-scores for alpha and beta, SD is the standard deviation and the MCID is the effect size. The Z-scores in common use:
- Value
- 1.96
- Value
- 1.645
- Value
- 0.84
- Value
- 1.28
Worked example. How many patients are needed per group to detect a 10-point improvement in WOMAC score? Take the MCID as 10 points, the SD as 20 points from the literature, alpha 0.05 (Zα 1.96) and power 0.80 (Zβ 0.84):
- n = 2 × (1.96 + 0.84)² × 20² / 10²
- n = 2 × 7.84 × 400 / 100
- n = 2 × 31.36
- n = 63 patients per group
Allowing for dropout. The sample must be inflated for anticipated loss to follow-up. Expecting 15% dropout, n = 63 / 0.85 = 74 patients per group, a total enrolment of 148.
Standardised Effect Size (Cohen's d)
Absolute and standardised. An effect size expressed in the units of the outcome, such as a 10-point WOMAC difference, is an absolute effect size. Dividing it by the standard deviation gives the standardised effect size, or Cohen's d, which is dimensionless and lets effects be compared across different scales.
Cohen's d = (mean difference) divided by the (pooled standard deviation)
- Cohen's d
- 0.2
- Approx. n per group (80% power, alpha 0.05)
- About 394
- Cohen's d
- 0.5
- Approx. n per group (80% power, alpha 0.05)
- About 64
- Cohen's d
- 0.8
- Approx. n per group (80% power, alpha 0.05)
- About 26
Why small effects are expensive. The required sample size is roughly proportional to 1 divided by the square of the standardised effect size. Halving the effect you wish to detect roughly quadruples the patients needed, and detecting a small standardised effect needs roughly an order of magnitude more patients than a large one, which is why a clinically tiny difference demands an enormous trial.
When there is no MCID. A distribution-based estimate of 0.5 standard deviation (a medium effect) is sometimes used as a transparent fallback. An anchor-based MCID is preferred, and where none exists an anchor-based MCID study is the alternative.
Types of Power Analysis
- When Performed
- Before study begins
- Purpose
- Calculate required sample size
- Validity
- Valid and recommended
- When Performed
- After study completed
- Purpose
- Calculate achieved power
- Validity
- Controversial - often misleading
- When Performed
- During planning
- Purpose
- Assess power across range of assumptions
- Validity
- Useful for uncertainty
A priori analysis. The sample size is calculated before any patient is enrolled, using an effect size and SD estimated from the literature or a pilot. This is the recommended approach, and it is what ensures a study is designed with adequate power.
Post hoc analysis. Power calculated after the study is complete, from the observed data, is often done to explain a non-significant result. It is mathematically redundant: post hoc power is derived directly from the p-value, so if p is not significant, post hoc power will be low by definition.
Never use post hoc power analysis. The arithmetic shows why:
- If p = 0.05, post hoc power ≈ 50%
- If p = 0.80, post hoc power ≈ 10%
This is mathematically circular and provides no additional information. Instead, examine the confidence intervals and effect size estimates for clinical relevance.
By study design. The method of calculation changes with the design.
- Power Analysis Method
- Standard two-group comparison
- Key Considerations
- Effect size, SD, alpha, power
- Complexity
- Basic
- Power Analysis Method
- Paired comparison
- Key Considerations
- Within-subject SD (smaller), carryover
- Complexity
- Moderate
- Power Analysis Method
- Account for clustering
- Key Considerations
- ICC, cluster size, number of clusters
- Complexity
- Complex
- Power Analysis Method
- One-sided, margin defined
- Key Considerations
- Non-inferiority margin, assay sensitivity
- Complexity
- Complex
Clinical Application
Underpowered orthopaedic trials. Across 117 randomised fracture-care trials including 19,942 patients, mean study power for the primary outcome was 24.65% (range 2-99%) and the Type II error rate was 90.52%. A field-wide mean power near a quarter means the typical trial had roughly a one-in-four chance of finding a difference that was really there. Small samples fail to detect clinically meaningful differences, so their results are inconclusive, not negative, and this is the most quotable statistic in orthopaedic evidence appraisal.
Statistical versus clinical significance. Statistical significance is p less than 0.05; clinical significance is a difference that exceeds the MCID. A statistically significant finding may not be clinically important, so always check whether the difference exceeds the MCID. Large studies detect trivial differences, and small studies miss important ones.
Pilot studies. A pilot estimates variability (the SD) and feasibility before the full trial and helps refine the sample size calculation. Do not use it for hypothesis testing.
How big the pilot should be. Not the 20 or 30 patients usually assumed, and the answer runs opposite to intuition: the smaller the effect you expect, the larger the pilot must be. For a main trial powered at 90% with two-sided alpha 0.05, the recommended pilot sizes per arm are 75, 25, 15 and 10 for extra-small (0.1), small (0.2), medium (0.5) and large (0.8) standardised effect sizes. A pilot exists to pin down the SD, and a small target effect leaves no room for an imprecise SD estimate; a pilot too small to fix the SD simply passes its error into the definitive trial.
Superiority, Equivalence and Non-inferiority Trials
The hypothesis a trial is designed to test determines its sample size and how a "negative" result may be read.
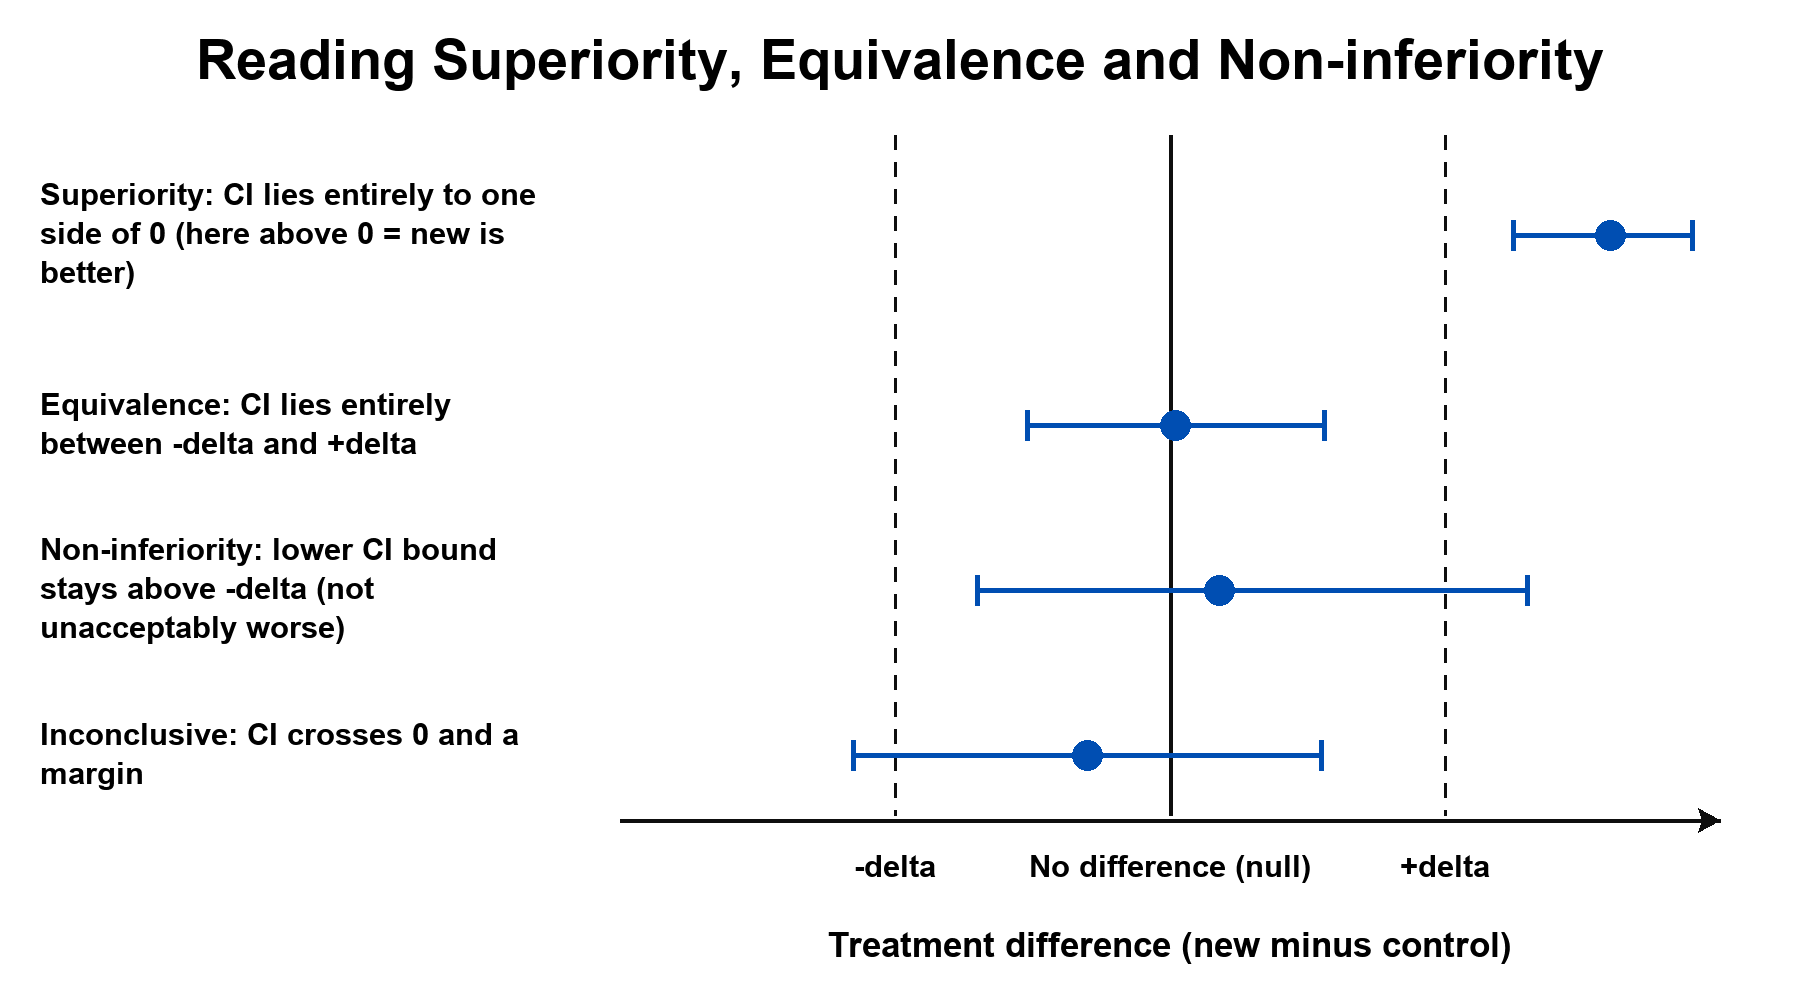
- Question
- Is the new treatment better than the comparator?
- Statistical approach
- Two-sided test of no difference; reject the null to claim superiority
- Question
- Is the new treatment neither better nor worse, within a margin?
- Statistical approach
- Two one-sided tests; the confidence interval must lie entirely within the equivalence margin (plus or minus delta)
- Question
- Is the new treatment not unacceptably worse than the standard?
- Statistical approach
- One-sided; the relevant confidence-interval bound must not cross the non-inferiority margin (delta)
The non-inferiority bargain. A non-inferiority trial accepts that the new treatment may be marginally worse, in exchange for advantages such as lower cost, toxicity or convenience, provided it stays within the pre-specified margin (delta). The margin must be clinically justified: too wide allows a genuinely inferior treatment to pass, too narrow demands an impractically large sample.
Assay sensitivity and the analysis set. Such trials require assay sensitivity, meaning the trial could have detected a true difference if one existed. Unlike superiority trials, the per-protocol analysis is at least as important as intention-to-treat, because dropouts and non-compliance bias toward apparent non-inferiority. Yet the per-protocol analysis may itself bias toward non-inferiority.
A non-significant superiority trial is inconclusive, not proof of equivalence. To show two treatments are equivalent or non-inferior you must design the trial for that purpose, with a pre-specified margin and (for non-inferiority) a one-sided comparison and a per-protocol analysis.
Software and Calculation Tools
- Cost
- Free
- Features
- Wide range of tests, user-friendly
- Best For
- Academic researchers, most designs
- Cost
- Free
- Features
- Simple interface, basic designs
- Best For
- Quick calculations, beginners
- Cost
- Commercial
- Features
- Comprehensive, regulatory accepted
- Best For
- Industry trials, complex designs
- Cost
- Commercial
- Features
- Extensive documentation, FDA submissions
- Best For
- Regulatory submissions
Online calculators. The ClinCalc sample size calculator is free online, OpenEpi covers power calculation for epidemiological studies, and Sealed Envelope offers clinical trial tools.
Simulation-based power. Simulation is used for complex designs (adaptive, cluster), non-standard distributions and multiple endpoints with correlations. Thousands of hypothetical datasets are simulated and each is analysed with the planned method; the proportion achieving significance is the estimated power.
Addressing Underpowered Studies
- Approach
- Enroll more participants
- Advantages
- Direct power increase
- Disadvantages
- More cost, time, resources
- Approach
- Pool recruitment across sites
- Advantages
- Achieves larger sample
- Disadvantages
- Heterogeneity, logistics complexity
- Approach
- Stricter inclusion criteria, standardized protocols
- Advantages
- Increases precision
- Disadvantages
- Reduces generalizability
- Approach
- Choose outcome with lower SD
- Advantages
- More precise measurement
- Disadvantages
- May not be clinically preferred
Multicentre trials and registries. When a single centre cannot recruit an adequate sample, multicentre collaboration achieves power. The AOANJRR and international registries provide large samples.
When power cannot be achieved. Three situations can put adequate power out of reach:
- Rare conditions may need registry-based or multinational studies
- Ethical constraints: more patients cannot be enrolled, for safety reasons
- Resource limitations: lower power is accepted, with pre-specified disclosure
Other approaches. Bayesian analysis can provide evidence even with small samples, and interpreting the confidence interval focuses attention on precision. Meta-analysis combines the effect estimates of multiple underpowered studies, and the pooled analysis has greater power than any individual study; it requires a systematic search and quality assessment, and heterogeneity (I²) must be evaluated.
Adaptive designs. Sample size re-estimation uses a pre-planned interim analysis to adjust the sample size to the observed variability, and maintains study validity if done properly. Group sequential designs run multiple pre-planned analyses during the trial, can stop early for efficacy or futility, and adjust alpha spending to maintain the overall Type I error.
Interim analyses for sample size re-estimation must be pre-specified in the protocol and use appropriate alpha spending functions (e.g., O'Brien-Fleming, Pocock). Unplanned interim analyses inflate Type I error and can introduce bias.
Common Pitfalls and Errors
- Problem
- Sample shrinks below powered size
- Consequence
- Underpowered final analysis
- Solution
- Inflate by 15-25% for attrition
- Problem
- MCID too large or optimistic
- Consequence
- Study underpowered for true effect
- Solution
- Use conservative, validated MCID
- Problem
- Variability higher than expected
- Consequence
- Lower power than calculated
- Solution
- Use upper bound of SD estimate
- Problem
- Many outcomes without correction
- Consequence
- Inflated Type I error
- Solution
- Adjust alpha (Bonferroni) or define primary outcome
Cluster trials. Ignoring the intraclass correlation (ICC) severely underestimates the sample, and an ICC of 0.05 can double or triple the required sample. The design needs many clusters, not just many individuals per cluster.
Reporting the calculation. A sample size statement should include:
- The alpha level
- The power level (usually 80%)
- The effect size, justified (MCID with reference)
- The source of the SD (literature or pilot)
- The statistical test
- The dropout or attrition adjustment
- The software or formula used
Guidelines, Registries & Global Practice
Why Power and Sample Size Are a Global Concern
Underpowering is not confined to any one country. The landmark survey of orthopaedic trauma RCTs found a mean primary-outcome power of roughly 25 percent and a Type-II error rate over 90 percent, and fragility analyses of sports-surgery trials worldwide report a median Fragility Index of only two patients. Adequately powered, registry-linked and multinational collaborations are the international response.
- Region
- Global (journals worldwide)
- Core Requirement
- Items 7a/7b: report how sample size was determined and any interim analyses
- Emphasis
- Transparency of a priori justification
- Region
- Global regulatory (FDA, EMA, PMDA)
- Core Requirement
- Pre-specify primary outcome, effect size, alpha, power and analysis set
- Emphasis
- Confirmatory trial rigour
- Region
- UK
- Core Requirement
- Funded trials must show a robust, MCID-anchored sample-size calculation
- Emphasis
- Value for public research funding
- Region
- Global
- Core Requirement
- Protocols must state sample-size assumptions before recruitment
- Emphasis
- Pre-registration of design
- Region
- Global trauma
- Core Requirement
- Promote multicentre recruitment to reach powered samples
- Emphasis
- Overcoming single-centre limits
Registries as a Power Solution
Large national arthroplasty and trauma registries supply the sample sizes single centres cannot. The AOANJRR (Australia), NJR (England, Wales, Northern Ireland and Isle of Man), AJRR (USA), SHAR (Sweden), the Norwegian Arthroplasty Register and the NZJR pool hundreds of thousands of procedures, giving the statistical power to detect small but clinically important differences in implant survival and revision rates that no individual RCT could achieve.
High- versus Limited-Resource Practice Variation
Access to dedicated trial units, biostatisticians, multicentre networks and mature registries makes adequately powered RCTs and registry studies feasible. Power and MCID-anchored calculations are an expected norm for grant funding and publication.
Smaller catchments, fewer statisticians and funding constraints make large RCTs difficult. Pragmatic responses include international collaboration, registry-based studies, Bayesian designs that extract more information from small samples, and honest pre-specified disclosure of limited power.
Controversies and Areas of Uncertainty
Where Experts Still Disagree
- One View
- 80% is the long-standing convention and keeps trials feasible
- Opposing View
- 20% chance of missing a true effect is too high for definitive surgical questions; 90% should be standard
- Pragmatic Position
- Use 90% for pivotal or hard-to-repeat trials; justify the choice explicitly
- One View
- Convenient when no anchor-based MCID exists
- Opposing View
- Detached from the patient's perspective; may not reflect what patients value
- Pragmatic Position
- Prefer validated anchor-based MCID; use 0.5 SD only as a transparent fallback
- One View
- Estimate SD, recruitment and feasibility before a full trial
- Opposing View
- Pilots estimate SD imprecisely and are misused for hypothesis testing
- Pragmatic Position
- Use adequately sized pilots for feasibility only, never for efficacy claims
- One View
- Intuitive measure of how robust a significant result is
- Opposing View
- Conflates significance with sample size and ignores effect magnitude
- Pragmatic Position
- Report alongside, not instead of, effect size and confidence intervals
- One View
- Familiar, regulator-accepted default
- Opposing View
- Arbitrary; some call for 0.005 or abandoning thresholds for estimation
- Pragmatic Position
- Pre-specify alpha; emphasise estimation with confidence intervals over dichotomising at 0.05
A non-significant result in a small trial means the study was inconclusive, not that the treatments are equivalent. Proving equivalence requires a purpose-designed equivalence or non-inferiority trial with a pre-specified margin - it can never be inferred from a failure to reach p less than 0.05 in an underpowered superiority trial.
MCQ Practice Points
Q: What is statistical power? A: The probability of detecting a true effect when it exists, calculated as 1 minus Beta (Type II error rate). Power = 80% means 80% chance of finding real difference if present, 20% risk of missing it.
Q: Which factor does NOT increase required sample size? A: Higher alpha (e.g., 0.10 vs 0.05) actually decreases required sample size. Factors that increase sample size: smaller effect size, higher power, higher variability (SD), lower alpha.
Q: Why is MCID important for sample size calculation? A: MCID defines the clinically meaningful effect size - the smallest difference that matters to patients. Using MCID ensures study is powered to detect differences that are clinically relevant, not just statistically significant. Without MCID, large studies may detect trivial differences.
Exam Viva Scenarios
Practise clinical reasoning and management decisions out loud
“You are planning an RCT to compare two surgical approaches for rotator cuff repair. What information do you need to calculate the required sample size?”
“You read an RCT comparing two implants for THA. The study found no significant difference (p = 0.15) with 40 patients per group. The power calculation shows the study had 35 percent power. How do you interpret this result?”
“A reviewer asks you to add a post hoc power calculation to your non-significant orthopaedic RCT to show it was adequately powered. The trial had 50 patients per arm. How do you respond, and how else might you convey the robustness of your findings?”
Core Concepts
- Power = 1 minus Beta = Probability of detecting true effect
- Conventional power = 80% (20% risk of Type II error)
- Sample size needs 4 inputs: Alpha, Power, Effect Size (MCID), SD
- Underpowered study = High risk of missing real effect (Type II error)
Sample Size Calculation Inputs
- Alpha = Type I error (usually 0.05) - false positive rate
- Power = 1 minus Beta (usually 0.80) - true positive rate
- Effect Size = MCID (clinically meaningful difference)
- SD = Variability (from literature or pilot study)
- Inflate by 15-20% for anticipated dropout
Factors Increasing Sample Size
- Smaller effect size (harder to detect)
- Higher power (90% vs 80%)
- Lower alpha (0.01 vs 0.05)
- Higher variability (larger SD)
- Expected dropout or loss to follow-up
Interpreting Power
- Power greater than 90% = Excellent, may be excessive
- Power 80-90% = Adequate and conventional
- Power 50-80% = Underpowered, risky
- Power under 50% = Severely underpowered, likely to fail
- Negative result from underpowered study = Inconclusive
Clinical Application
- MCID defines clinical relevance, not just statistical significance
- Many orthopaedic RCTs are underpowered (power under 80%)
- Pilot studies estimate SD and feasibility, NOT for hypothesis testing
- Absence of evidence is NOT evidence of absence (underpowered studies)
- Wide confidence intervals indicate insufficient precision
Evidence Base
Type-II Error Rates in Orthopaedic Trauma RCTs
- Systematic survey of 117 randomised fracture-care trials (1968-1999) including 19,942 patients, sample sizes ranging from 10 to 662 (mean 95, SD 79), with hip fractures the commonest subject at 34 per cent
- Mean study power for the primary outcome was only 24.65% (range 2% to 99%)
- The Type-II error rate (beta) for primary outcomes was 90.52% - far above the accepted 20% threshold
- Most trials were grossly underpowered; performing a priori power and sample-size calculations is the corrective
Understanding the MCID: Concepts and Methods
- Defines the MCID as the smallest improvement a patient considers worthwhile - the effect size that should anchor sample-size calculations
- MCID is derived by anchor-based methods (linked to an external patient-reported criterion) or distribution-based methods (e.g. 0.5 standard deviation, standard error of measurement)
- Three core limitations: multiplicity of MCID estimates, loss of the patient's perspective, and dependence on the baseline score
- No single MCID is universal; the value depends on the instrument, population and method used
CONSORT 2010: Reporting Standard for Sample Size
- CONSORT Item 7a requires authors to report how the sample size was determined
- CONSORT Item 7b requires reporting of interim analyses and stopping guidelines where applicable
- Sample-size justification should state the target effect size, power, alpha and the assumed standard deviation
- Adopted worldwide by leading journals to make trial adequacy transparent to readers