Research Methodologies | Study Hierarchy | Evidence Quality
Study Design Hierarchy
Critical Must-Knows
- RCT: Random allocation eliminates selection bias and balances known/unknown confounders
- Cohort Study: Follows exposed and unexposed groups forward in time to measure outcomes
- Case-Control Study: Starts with disease (cases) and no disease (controls), looks backward for exposures
- Cross-Sectional Study: Snapshot in time - measures exposure and outcome simultaneously
- Case Series: Descriptive study of patients with similar condition - no comparison group
Clinical Pearls
- "RCT is gold standard for therapeutic interventions but not always ethical or feasible
- "Cohort studies are best for rare exposures; Case-control studies are best for rare outcomes
- "Observational studies are prone to confounding and bias - must use statistical adjustment
- "Registry studies provide real-world effectiveness data but lack randomization
Critical Study Design Concepts
Experimental vs Observational
Experimental: Investigator assigns intervention (RCT). Observational: Investigator observes without intervention (Cohort, Case-Control).
Prospective vs Retrospective
Prospective: Data collected going forward from study start. Retrospective: Uses existing data from past records.
Randomization Importance
Randomization balances: Known confounders, Unknown confounders, Selection bias. Creates comparable groups at baseline.
Internal vs External Validity
Internal: Are results valid within study? External: Can results be generalized to other populations?
At a Glance
Research study designs form an evidence hierarchy with randomized controlled trials (RCTs) at the apex (Level I) because randomization eliminates selection bias and balances both known and unknown confounders. Cohort studies (Level II) follow exposed vs unexposed groups forward in time—best for rare exposures. Case-control studies (Level III) compare cases with disease to controls without, looking backward for exposures—best for rare outcomes. Observational designs are prone to confounding and bias requiring statistical adjustment. The key distinction is experimental (investigator assigns intervention) vs observational (investigator only observes), and internal validity (are results valid within the study?) vs external validity (can results be generalized?).
RCCCCEStudy Design Hierarchy (Therapeutic Questions)
| R | Randomized Controlled Trials Level I - Gold standard for treatment |
| C | Cohort Studies (Prospective) Level II - Follow groups forward |
| C | Case-Control Studies Level III - Compare cases to controls |
| C | Case Series Level IV - Descriptive series |
| C | Cross-sectional Studies Prevalence surveys |
| E | Expert Opinion Level V - Lowest evidence |
| R | Randomized Controlled Trials Level I - Gold standard for treatment | C | Case-Control Studies Level III - Compare cases to controls | C | Cross-sectional Studies Prevalence surveys |
| C | Cohort Studies (Prospective) Level II - Follow groups forward | C | Case Series Level IV - Descriptive series | E | Expert Opinion Level V - Lowest evidence |
Hook:Research Creates Clear Clinical Conclusions Effectively - from highest to lowest quality evidence!
FINERChoosing the Right Study Design
| F | Feasible Can you complete the study with available resources? |
| I | Interesting Does it address an important clinical question? |
| N | Novel Does it fill a gap in current knowledge? |
| E | Ethical Can it be done without harm to participants? |
| R | Relevant Will results impact clinical practice? |
| F | Feasible Can you complete the study with available resources? | E | Ethical Can it be done without harm to participants? |
| I | Interesting Does it address an important clinical question? | R | Relevant Will results impact clinical practice? |
| N | Novel Does it fill a gap in current knowledge? |
Hook:FINER criteria help you choose the right research question and design!
Overview/Introduction
Randomized Controlled Trial (RCT)
Definition: Participants are randomly allocated to intervention or control groups, then followed prospectively to measure outcomes.
Key Features:
- Randomization: Eliminates selection bias and balances confounders
- Prospective: Follows participants forward in time
- Control Group: Provides comparison to measure treatment effect
- Blinding: Can be single-blind, double-blind, or triple-blind
RCT Variations
| Design | Description | Advantage | Disadvantage |
|---|---|---|---|
| Parallel Group | Two separate groups compared | Simple analysis, most common | Requires large sample size |
| Crossover | Each participant receives both treatments | Smaller sample needed, controls for individual variation | Requires washout period, carryover effects |
| Factorial | Tests 2 or more interventions simultaneously | Efficient, can assess interactions | Complex analysis, increased sample size |
| Cluster | Groups (hospitals, clinics) randomized, not individuals | Prevents contamination, practical | Larger sample needed, complex statistics |
Strengths of RCTs:
- Highest level of evidence for therapeutic questions
- Minimizes bias and confounding
- Establishes causality
Limitations of RCTs:
- Expensive and time-consuming
- May not reflect real-world practice (narrow inclusion criteria)
- Not ethical for harmful exposures
- Not feasible for rare outcomes
Understanding these experimental designs is essential for critically appraising treatment studies.
Concepts and Principles
Evidence Hierarchy Principles
The evidence hierarchy is fundamental to understanding study quality:
Level I Evidence: Systematic reviews/meta-analyses of RCTs, or individual high-quality RCTs
- Provides strongest evidence for causation
- Randomization controls for known and unknown confounders
- Gold standard for therapeutic questions
Level II Evidence: Prospective cohort studies, lesser-quality RCTs
- Cannot prove causation (association only)
- Prone to confounding and selection bias
- Appropriate when RCTs are not ethical/feasible
Level III Evidence: Case-control studies, retrospective cohort studies
- High risk of recall bias and selection bias
- Best for rare diseases or outcomes
- Establishes temporal relationship for case-control
Level IV Evidence: Case series, cross-sectional studies
- No comparison group (case series)
- Cannot establish temporal relationship
- Useful for describing disease characteristics
Level V Evidence: Expert opinion, case reports
- Lowest level of evidence
- Subject to individual bias and experience
- May generate hypotheses for future research
Observational Analytical Study Designs
Cohort Studies
Definition: Follows groups with and without exposure forward in time to compare incidence of outcomes.
Types:
Prospective Cohort Study
Process:
- Identify exposed and unexposed groups at baseline
- Follow both groups forward in time
- Measure incidence of outcomes
- Calculate relative risk (RR)
Example: Follow surgeons who operate (exposed) vs those who do not (unexposed) to measure radiation exposure and cancer risk.
Strengths:
- Can calculate incidence and relative risk
- Multiple outcomes can be studied
- Temporal relationship clear (exposure precedes outcome)
- Less prone to recall bias
Limitations:
- Time-consuming and expensive
- Loss to follow-up
- Not efficient for rare outcomes
- Confounding possible
Prospective cohort studies provide Level II evidence.
Case-Control Studies
Definition: Starts with cases (disease present) and controls (disease absent), then looks backward to compare exposure history.
Process:
- Identify cases with the disease/outcome
- Select controls without the disease (matched or unmatched)
- Measure past exposure in both groups
- Calculate odds ratio (OR)
Example: Compare patients with AVN (cases) to those without AVN (controls) to assess whether steroid use (exposure) was more common in cases.
Strengths:
- Efficient for rare diseases
- Faster and cheaper than cohort studies
- Can study multiple exposures
- Small sample size needed
Limitations:
- Cannot calculate incidence or relative risk (only OR)
- Prone to recall bias and selection bias
- Temporal relationship unclear
- Confounding common
Key Point: Case-control studies are Level III evidence - useful for rare outcomes but inferior to cohort studies for establishing causality.
Observational Descriptive Study Designs
Cross-Sectional Studies
Definition: Measures exposure and outcome at a single point in time (snapshot).
Uses:
- Prevalence surveys
- Screening studies
- Hypothesis generation
Example: Survey orthopaedic surgeons to measure prevalence of burnout and correlate with work hours.
Strengths:
- Quick and inexpensive
- Good for prevalence data
- Generates hypotheses
Limitations:
- Cannot establish causality
- Cannot measure incidence
- Temporal relationship unclear (which came first?)
- Survival bias
Case Series and Case Reports
Definition: Descriptive study of patients with similar condition - no comparison group.
Uses:
- Describe new diseases or rare conditions
- Report novel surgical techniques
- Generate hypotheses
Strengths:
- Simple to conduct
- Useful for rare conditions
- Hypothesis-generating
Limitations:
- No comparison group (no control)
- Cannot establish causality
- Selection bias
- Level IV evidence only
Understanding descriptive studies helps identify when stronger evidence is needed.
Study Design Components
Essential Components of Any Study
Population and Sampling:
- Target population: The group about whom conclusions will be drawn
- Study sample: Subset of population actually studied
- Sampling method: How participants are selected (random, consecutive, convenience)
Exposure and Outcome:
- Exposure/Intervention: What is being studied (treatment, risk factor)
- Outcome: What is being measured (disease, recovery, complication)
- Primary vs Secondary: Main outcome vs additional outcomes
Time Frame:
- Prospective: Follow participants forward in time
- Retrospective: Look back at existing data
- Cross-sectional: Single point in time
Classification
Study Design Classification
Primary Classification of Study Designs
| Category | Type | Investigator Role | Examples |
|---|---|---|---|
| Experimental | Randomized Controlled Trial | Assigns intervention | Drug trial, surgical technique comparison |
| Observational Analytical | Cohort Study | Observes only | Smoking and nonunion, registry studies |
| Observational Analytical | Case-Control Study | Observes only | Rare disease risk factors |
| Observational Descriptive | Cross-Sectional | Observes only | Prevalence surveys |
| Observational Descriptive | Case Series | Observes only | Novel technique reports |
Clinical Application
Choosing Design for Therapeutic Questions
Question: Does treatment A work better than treatment B? Best Design: RCT (if ethical and feasible) Alternative: Prospective cohort study
Choosing Design for Rare Outcomes
Question: Does exposure increase risk of rare disease? Best Design: Case-control study Alternative: Large registry cohort
Choosing Design for Prevalence
Question: How common is condition X in population Y? Best Design: Cross-sectional survey Alternative: Registry analysis
Choosing Design for Prognosis
Question: What is the natural history of disease X? Best Design: Prospective cohort study Alternative: Retrospective cohort from registry
Bias and Confounding
Types of Bias
Selection Bias:
- Systematic error in how participants are selected
- Example: Only including patients who survived long enough to be studied
- Prevention: Random sampling, consecutive enrollment
Information/Measurement Bias:
- Systematic error in how data is collected
- Recall bias: Cases remember exposures better than controls
- Observer bias: Assessor influenced by knowledge of group allocation
- Prevention: Blinding, standardized measurement
Confounding:
- Third variable associated with both exposure and outcome
- Creates spurious association or masks true association
- Prevention: Randomization, matching, stratification, multivariable analysis
Systematic Reviews and Meta-Analysis
Systematic Review
Definition: Comprehensive, reproducible synthesis of all available evidence on a specific question.
Key Features:
- Explicit, pre-specified methods
- Comprehensive literature search
- Critical appraisal of included studies
- Qualitative or quantitative synthesis
PRISMA Guidelines:
- Preferred Reporting Items for Systematic Reviews and Meta-Analyses
- 27-item checklist for transparent reporting
- Flow diagram showing study selection process
Meta-Analysis
Definition: Statistical combination of results from multiple studies.
When Appropriate:
- Studies are clinically and methodologically similar
- Heterogeneity is acceptable (I² less than 75%)
- Provides pooled effect estimate with confidence interval
Registry Studies in Orthopaedics
Registry-Based Research
Definition: Large-scale observational studies using data from national or regional registries.
Major Orthopaedic Registries:
- AOANJRR (Australian): Largest national registry, over 500,000 THAs/TKAs
- Swedish Hip Arthroplasty Register: Established 1979, longest follow-up
- National Joint Registry (UK): Over 3 million procedures recorded
- American Joint Replacement Registry (AJRR): Growing database
Strengths:
- Large sample sizes (100,000s of patients)
- Real-world effectiveness data
- Long follow-up periods
- Detect rare outcomes and complications
- Track implant performance
Limitations:
- Observational only (no randomization)
- Confounding by indication
- Variable data quality
- Limited clinical detail
Limitations and Pitfalls
Common Pitfalls by Design
RCT Pitfalls:
- Underpowered studies (Type II error)
- Poor allocation concealment
- Unblinded outcome assessors
- Per-protocol analysis instead of ITT
- Narrow inclusion criteria limiting generalizability
Cohort Study Pitfalls:
- Loss to follow-up (over 20% is concerning)
- Confounding by indication
- Immortal time bias
- Selection of exposed/unexposed groups
Case-Control Pitfalls:
- Inappropriate control selection
- Recall bias (cases remember better)
- Selection bias
- Cannot calculate incidence or RR
Statistical Measures by Design
Measures of Association
Relative Risk (RR):
- Used in: Cohort studies, RCTs
- Incidence in exposed / Incidence in unexposed
- RR greater than 1 = increased risk with exposure
- Can calculate from prospective studies only
Odds Ratio (OR):
- Used in: Case-control studies (also cohort, RCT)
- Odds of exposure in cases / Odds of exposure in controls
- Approximates RR when outcome is rare (less than 10%)
- Only measure available from case-control design
Hazard Ratio (HR):
- Used in: Survival analysis (time-to-event)
- Instantaneous risk of event at any time point
- Accounts for censoring and time-varying exposure
Outcomes and Endpoints
Types of Outcomes
Primary Outcome:
- Main outcome the study is powered to detect
- Should be clinically meaningful
- Used to calculate sample size
- Only ONE primary outcome (multiple = type I error inflation)
Secondary Outcomes:
- Additional outcomes of interest
- Exploratory - not powered to detect
- Generate hypotheses for future studies
Surrogate vs Patient-Centered:
- Surrogate: Lab value, radiograph (e.g., radiographic union)
- Patient-centered: Function, pain, quality of life (e.g., PROMIS scores)
- Surrogate outcomes may not correlate with patient-centered outcomes
Evidence Base
CONSORT 2010 Statement for Reporting Randomised Trials
- CONSORT 2010 provides a 25-item checklist for transparent reporting of parallel-group RCTs
- Mandates a flow diagram documenting participant flow through enrolment, allocation, follow-up and analysis
- Updated from the 2001 version to incorporate new methodological evidence on bias
- Published simultaneously across BMJ, Lancet, Annals of Internal Medicine and other major journals to maximise dissemination
STROBE Statement for Reporting Observational Studies
- STROBE provides a 22-item checklist covering cohort, case-control and cross-sectional designs
- Eighteen items are common to all three designs; four are design-specific
- Developed at a 2004 methodologists' workshop with iterative consensus revision
- Accompanied by a separate Explanation and Elaboration document with worked examples
RCTs, Observational Studies and the Hierarchy of Research Designs
- Compared meta-analyses of RCTs against observational studies addressing the same five clinical topics (99 reports)
- Average effect estimates from well-designed observational studies were remarkably similar to those of RCTs
- Example: BCG vaccine RR 0.49 (95% CI 0.34-0.70) from 13 RCTs versus OR 0.50 (95% CI 0.39-0.65) from 10 case-control studies
- The spread of point estimates was actually wider across RCTs than across observational studies
PRISMA 2020 Statement for Reporting Systematic Reviews
- PRISMA 2020 replaces the 2009 statement with a 27-item checklist plus an abstract checklist
- Revised flow diagrams document study identification, screening, eligibility and inclusion
- Updated to reflect advances in search, selection, appraisal and synthesis methods
- Includes expanded item-level reporting guidance to aid implementation
GRADE: Rating Quality of Evidence and Strength of Recommendations
- GRADE rates evidence as high, moderate, low or very low quality, separately from strength of recommendation
- RCTs start as high-quality but can be downgraded for risk of bias, inconsistency, indirectness, imprecision or publication bias
- Observational studies start as low-quality but can be upgraded for large effect, dose-response or plausible residual confounding
- Adopted by WHO, NICE, Cochrane and numerous guideline developers worldwide
User's Guide to the Orthopaedic Literature: Article About a Surgical Therapy
- Frames critical appraisal of a surgical therapy study around validity, results and applicability
- Validity hinges on randomisation, allocation concealment, blinding and intention-to-treat analysis
- Stresses complete follow-up and analysis of patients in their assigned groups
- Translates generic evidence-based-medicine appraisal into surgical decision-making
Exam Viva Scenarios
Use these scenarios to practise clinical reasoning and management decisions
Scenario 1: Study Design Selection
"You want to study whether smoking increases the risk of nonunion after tibial fracture. What study design would you choose and why?"
Scenario 2: Critically Appraising an RCT
"You are reviewing an RCT comparing operative vs non-operative treatment for displaced ankle fractures. What key features would you look for to assess the quality of this trial?"
MCQ Practice Points
Study Design Question
Q: A researcher wants to study the association between high BMI and knee osteoarthritis. She measures BMI and presence of knee OA in 500 patients at a single clinic visit. What type of study is this? A: Cross-sectional study. Exposure (BMI) and outcome (OA) are measured at the same point in time. This design can measure prevalence but cannot establish causality or temporal relationship.
RCT Advantage Question
Q: What is the main advantage of randomization in an RCT? A: Balances both known and unknown confounders between groups. Randomization creates groups that are comparable at baseline, eliminating selection bias and confounding, allowing isolation of treatment effect.
Case-Control Study Question
Q: When is a case-control study the preferred design? A: For rare diseases or outcomes. Case-control studies are efficient because you start with cases (already have the rare disease) and look backward for exposures. Much faster than waiting for rare outcome to occur in a cohort.
Guidelines, Registries & Global Practice
Study-design methodology is governed by international reporting standards and evidence-grading frameworks rather than disease-specific clinical guidelines. The dominant frameworks are convergent worldwide: CONSORT for trials, STROBE for observational studies, PRISMA for systematic reviews, and GRADE for rating certainty of evidence. National bodies layer their own evidence hierarchies on top of these, and large national arthroplasty registries supply the real-world observational evidence that complements the trial literature.
Reporting Standards and Evidence Frameworks (Side-by-Side)
Major Evidence Frameworks and Reporting Standards
| Framework / Body | Region | Purpose | Output |
|---|---|---|---|
| CONSORT 2010 | International (EQUATOR) | Reporting of RCTs | 25-item checklist + flow diagram |
| STROBE | International (EQUATOR) | Reporting of observational studies | 22-item checklist (cohort/case-control/cross-sectional) |
| PRISMA 2020 | International (EQUATOR) | Reporting of systematic reviews | 27-item checklist + flow diagram |
| GRADE | International (WHO, Cochrane) | Rating certainty of evidence + recommendation strength | High / Moderate / Low / Very low |
| OCEBM Levels (Oxford) | UK / international | Level of evidence by question type | Levels 1-5, question-specific |
| NHMRC Levels & FORM | Australia | Evidence hierarchy + recommendation grades | Levels I-IV, Grades A-D |
| NICE methods (UK) | UK | Guideline development using GRADE | GRADE-based evidence profiles |
Position of the Major Guideline Bodies
AAOS (United States)
The American Academy of Orthopaedic Surgeons Clinical Practice Guidelines grade each recommendation (Strong, Moderate, Limited, Consensus) according to the level of evidence underpinning it, using a system derived from the Oxford/CEBM hierarchy and explicit risk-of-bias appraisal.
NICE & BOA (United Kingdom)
NICE develops guidance using the GRADE approach, separating certainty of evidence from strength of recommendation. The British Orthopaedic Association Standards (BOASTs) translate this evidence into auditable practice standards.
AO Foundation & EFORT (Europe)
The AO Foundation and EFORT promote structured evidence appraisal and education across Europe, applying CONSORT/STROBE/PRISMA to trauma and arthroplasty literature and supporting multinational registry collaboration.
NHMRC (Australia)
The National Health and Medical Research Council evidence hierarchy spans Levels I-IV with recommendation Grades A-D under the FORM framework. It mirrors international standards but explicitly incorporates Australian registry evidence.
National Arthroplasty Registries (Global Practice Variation)
Major National Joint Replacement Registries
| Registry | Country | Established | Scale / Notable Feature |
|---|---|---|---|
| Swedish Knee/Hip Arthroplasty Registers | Sweden | 1975 (knee) / 1979 (hip) | Longest continuous follow-up; pioneered registry methodology |
| AOANJRR | Australia | 1999 | Near-complete national capture; mandatory reporting; early outlier-implant detection |
| National Joint Registry (NJR) | UK (Eng/Wales/NI/IoM) | 2003 | Over 3 million procedures; surgeon- and unit-level outcomes |
| American Joint Replacement Registry (AJRR) | USA | 2009 | Largest by annual volume; voluntary participation, growing coverage |
Registries demonstrate practice variation in real time: the AOANJRR famously identified poorly performing metal-on-metal hip resurfacing and large-head designs years before they were withdrawn, illustrating how high-completeness observational data can detect rare device failures that no individual RCT is powered to find. Registry effectiveness data (real-world, all-comers) complements RCT efficacy data (selected populations, ideal conditions).
Exam Relevance
For the exam you must be able to:
- Critically appraise a published study against the appropriate reporting standard (CONSORT/STROBE/PRISMA)
- Match the appropriate design to a clinical question (therapy, prognosis, harm, diagnosis)
- Explain why GRADE can downgrade an RCT or upgrade observational data
- Interpret national registry survival data (Kaplan-Meier, hazard ratios, revision endpoints) including AOANJRR and NJR
- Distinguish statistical significance from clinical significance (MCID)
Distinguishing Look-Alike Designs
A frequent exam trap is mislabelling a study design. Use the table below to separate designs that are commonly confused, based on the direction of enquiry and the measures they permit.
Differentiating Commonly Confused Study Designs
| Feature | Prospective Cohort | Retrospective Cohort | Case-Control | Cross-Sectional |
|---|---|---|---|---|
| Starting point | Exposure status | Exposure status (past records) | Outcome (disease) status | Neither - sampled population |
| Direction | Exposure → outcome (forward) | Exposure → outcome (forward, in records) | Outcome → exposure (backward) | Simultaneous snapshot |
| Temporality established | Yes | Yes | Often unclear | No |
| Primary measure | Relative risk, incidence | Relative risk, incidence | Odds ratio | Prevalence, prevalence OR |
| Best suited to | Rare exposures, prognosis | Rare exposures with existing data | Rare outcomes | Prevalence / hypothesis generation |
| Dominant bias | Loss to follow-up, confounding | Data quality, missing data | Recall and selection bias | Survivor bias, temporal ambiguity |
Management Algorithm
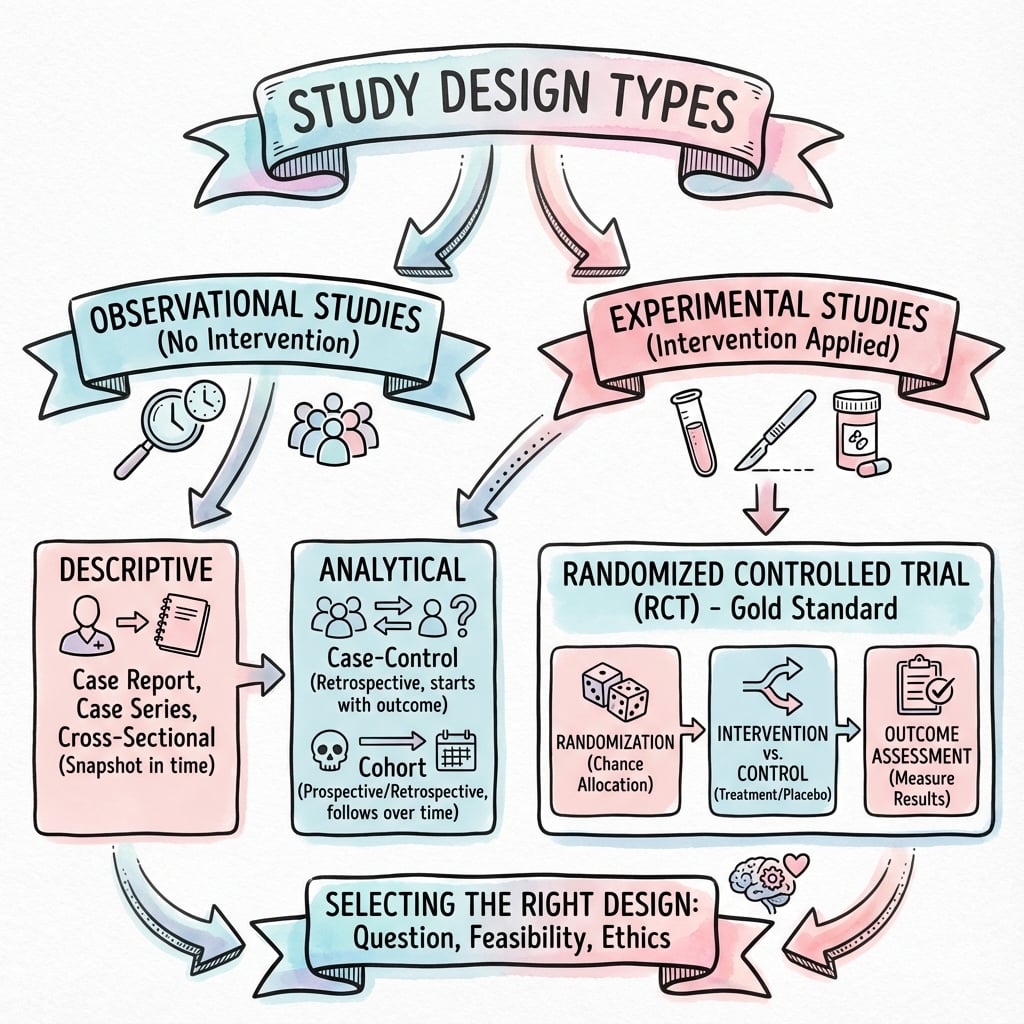
STUDY DESIGN TYPES
Clinical summary
Study Design Hierarchy
- •Level I = RCT, Systematic Review of RCTs
- •Level II = Prospective Cohort, Lesser RCTs
- •Level III = Case-Control, Retrospective Cohort
- •Level IV = Case Series, no control group
- •Level V = Expert Opinion, lowest evidence
Key Design Features
- •RCT = Randomization + Prospective + Control group
- •Cohort = Exposure → Outcome (forward in time)
- •Case-Control = Outcome → Exposure (backward in time)
- •Cross-sectional = Snapshot (exposure and outcome at same time)
- •Case Series = Descriptive only, no comparison
Design Selection
- •Therapeutic question + Ethical + Feasible = RCT
- •Rare exposure = Cohort study
- •Rare outcome = Case-control study
- •Prevalence question = Cross-sectional survey
- •Harmful exposure = Observational (cohort), NOT RCT
RCT Critical Features
- •Randomization eliminates selection bias
- •Allocation concealment prevents manipulation
- •Blinding prevents performance and detection bias
- •Intention-to-treat preserves randomization
- •CONSORT = reporting guidelines for RCTs
Common Pitfalls
- •Cross-sectional cannot establish causality (temporal relationship unclear)
- •Case-control cannot calculate relative risk (only OR)
- •Cohort studies prone to loss to follow-up
- •Case series have selection bias and no comparison
- •Confounding common in all observational designs