Kaplan-Meier, Cox Regression and Implant Survivorship
- SURVIVAL (time-to-event) analysis studies the TIME until a defined EVENT/ENDPOINT occurs - in orthopaedics most often implant REVISION - and its defining feature is the handling of CENSORING: a patient is 'censored' when they are lost to follow-up, die, or simply have not yet had the event at the end of the study, and they still contribute information up to their last follow-up rather than being discarded.
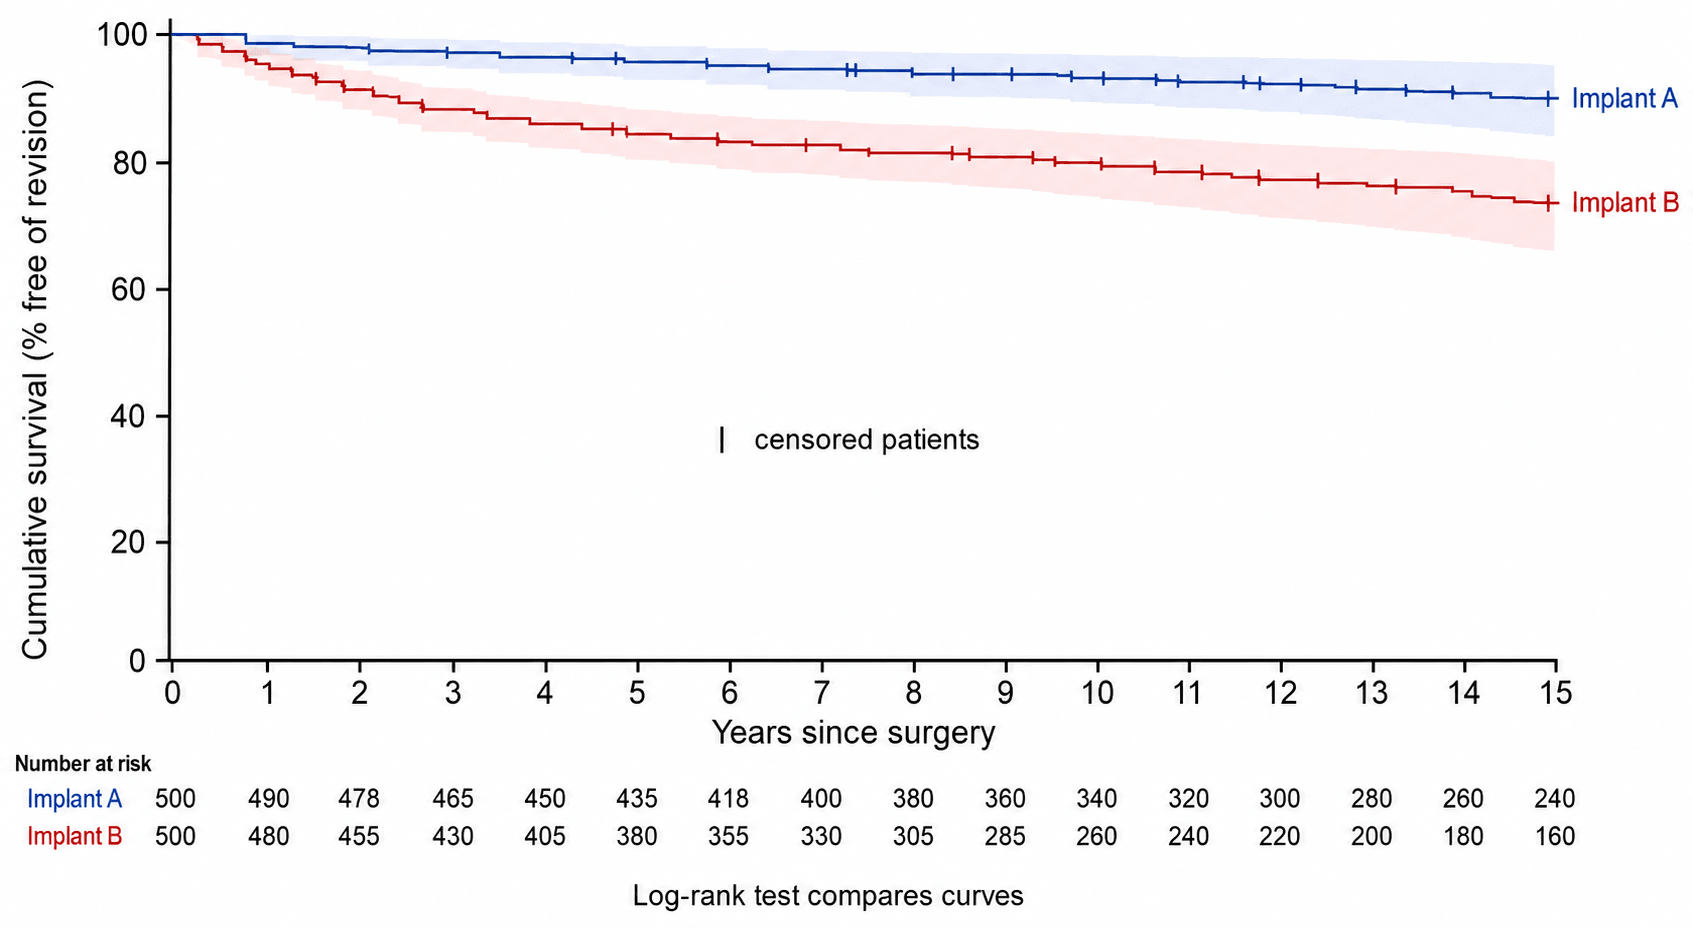
- The KAPLAN-MEIER (KM) estimator is the non-parametric way to estimate the survival function: a descending STEP CURVE of cumulative survival against time, with the survival probability dropping at each event and censored patients marked (tick marks); it lets you read off SURVIVORSHIP at a time point (e.g. '95% 10-year survivorship') with a CONFIDENCE INTERVAL.
- The NUMBER AT RISK falls over time and is usually tabulated beneath the curve; at late time points FEW patients remain at risk, so the curve is unstable and the CONFIDENCE INTERVALS WIDEN - late survivorship estimates should be interpreted with caution.
- The LOG-RANK TEST compares two or more KM curves (e.g. two implants) for a statistically significant difference; COX PROPORTIONAL-HAZARDS REGRESSION is the multivariable extension that estimates a HAZARD RATIO (HR) for each predictor (age, BMI, implant type) while adjusting for the others - an HR above 1 indicates increased hazard (e.g. HR 2.7 = 2.7 times the instantaneous risk).
- The ENDPOINT must be defined precisely - 'revision for ANY cause' versus revision for a SPECIFIC reason (e.g. aseptic loosening) - because it changes the survivorship dramatically; registries (NJR, AOANJRR and others) report implant survivorship this way, and pitfalls include 'implant camouflage', where a poorly performing component is masked within an overall well-performing brand.
- A key trap is the COMPETING RISK of DEATH: standard KM treats death as censoring, but a patient who dies can never be revised, so in ELDERLY cohorts KM 'survival free of revision' OVERESTIMATES the true cumulative risk of revision; a COMPETING-RISKS (cumulative incidence) analysis gives a more accurate absolute revision risk.
- “Censoring = incomplete follow-up (lost/died/event-free at end) still contributes data up to last follow-up; KM handles it.
- “Kaplan-Meier = step survivorship curve (+ censoring ticks, number at risk, widening CIs late); log-rank compares curves; Cox gives the hazard ratio.
- “Define the endpoint precisely (any-cause vs aseptic loosening); beware the competing risk of DEATH - KM overestimates revision risk in the elderly (use competing-risks analysis).
Few patients at risk at late time points -> wide confidence intervals and an unreliable tail of the KM curve. Don't over-interpret late survivorship.
KM treats death as censoring, but the dead can't be revised - so KM overestimates revision risk in elderly cohorts. Use competing-risks (cumulative incidence) analysis.
Censoring & the Kaplan-Meier Curve
Ordinary statistics struggle with follow-up data because not everyone is followed for the same time and not everyone has the event. Survival analysis solves this with censoring: a patient who is lost to follow-up, dies, or reaches the end of the study without the event is censored at their last known follow-up and still contributes the information that they were event-free up to that point. The KAPLAN-MEIER estimator uses this to build a step survival curve - cumulative survival starts at 100% and steps down at each event, with censored patients marked by ticks - from which you read survivorship at a time point (for example a 10-year implant survivorship) with a confidence interval. The number at risk is tabulated beneath the curve and falls over time, so the late part of the curve is based on few patients and is uncertain (wide confidence intervals).
Comparing Curves: Log-Rank & Cox Regression
- Log-rank test: a non-parametric hypothesis test comparing two or more KM curves (e.g. two implants or two patient groups) for a significant difference in survival over the whole follow-up.
- Cox proportional-hazards regression: the multivariable model of survival analysis. It estimates a HAZARD RATIO (HR) for each predictor (e.g. implant design, age, BMI, sex) while adjusting for the others; an HR above 1 means increased hazard, below 1 means protective, and 1 means no effect (e.g. an HR of 2.7 means 2.7 times the instantaneous risk of the event). It assumes the proportional- hazards assumption (the hazard ratio is roughly constant over time).
- Registries use these to compare implants and identify risk factors for failure - but interpret with care (endpoint definition, follow-up, competing risks).
| Tool | What it does | Output |
|---|
Implant Survivorship & Pitfalls
- Define the endpoint: 'revision for ANY cause' gives a lower survivorship than revision for a SPECIFIC cause (e.g. aseptic loosening) - always check which is reported.
- Number at risk / follow-up: late survivorship rests on few patients; demand the number-at-risk table and beware wide late confidence intervals.
- Competing risk of death: in older patients, KM (which censors deaths) overestimates the cumulative revision risk; a competing-risks/cumulative-incidence analysis is more truthful about absolute risk.
- Implant 'camouflage': a poorly performing component combination can be hidden within an overall well-performing brand portfolio in registry averages - so brand-level KM can mask a bad combination.
- Selection/ascertainment: revision as an endpoint underestimates failure (some failing implants are not revised, e.g. unfit patients), and depends on complete registry capture.
Evidence & Key Studies
Implant camouflage: how registry data can mask poor implant results (case-control study)
- Used Kaplan-Meier survival analysis and Cox regression to assess TKA component combinations, with revision for aseptic loosening as the endpoint.
- High-risk component combinations had over a 10-fold higher revision rate, with KM curves whose 95% confidence intervals did not overlap the controls.
- Demonstrates 'implant camouflage' - a poorly performing combination hidden within an overall well-performing brand - and the importance of granular survivorship analysis.
Survival of total knee arthroplasty in patients with Parkinson's disease: a registry study
- Kaplan-Meier survivorship (endpoint: revision) showed 13-year implant survival of 88.8% in Parkinson's disease versus 94.3% in controls.
- Cox multivariate analysis gave a hazard ratio of about 2.7 for implant failure in Parkinson's disease after adjusting for age and gender, and 1.7 for constrained designs.
- Illustrates KM survivorship rates with confidence and Cox hazard ratios identifying risk factors for failure.
According to PubMed, the use of Kaplan-Meier survival analysis and Cox regression for implant survivorship, the 'implant camouflage' pitfall and the importance of endpoint definition come from the cited Sheridan study, and the worked example of KM survivorship rates with Cox hazard ratios from the cited Panciera registry study. The concepts of censoring, the log-rank test, the proportional-hazards assumption and the competing risk of death are standard, well-established statistical teaching. (See also our Study Design, Diagnostic Test Statistics and Measures of Effect topics.)
Clinical Decision Scenarios
Practise clinical reasoning and management decisions out loud
“What is a Kaplan-Meier survival curve, what is censoring, and how would you compare two implants' survivorship?”
“Why can Kaplan-Meier overestimate the risk of implant revision in elderly patients, and what is the alternative?”
Mnemonics & Memory Aids
CENSOR
Hook:Survival analysis revolves around CENSORing.
KM vs COX
Hook:KM draws the curve; Cox gives the adjusted hazard ratio.
Core concepts
- Time-to-event analysis; endpoint usually implant revision
- Censoring: lost/died/event-free at end -> data to last follow-up
- Number at risk falls -> late curve unstable (wide CIs)
Tools
- Kaplan-Meier: step survivorship curve + survival % at time points (CI)
- Log-rank test: compares 2+ curves
- Cox proportional-hazards regression: adjusted HAZARD RATIO (HR)
Interpreting HR
- HR above 1 = increased hazard; below 1 = protective; 1 = no effect
- Assumes proportional hazards (HR roughly constant over time)
- HR is RELATIVE risk, not absolute
Pitfalls
- Define endpoint (any-cause vs specific); 'implant camouflage' in registries
- Competing risk of death: KM overestimates revision risk in elderly -> use cumulative incidence
- Late survivorship rests on few patients - interpret cautiously