Evidence Hierarchy | GRADE System | Clinical Application
- Level I Evidence: High-quality RCT with randomization, blinding, adequate power, low loss to follow-up
- GRADE System: Assesses quality of evidence (High/Moderate/Low/Very Low) AND strength of recommendations (Strong/Weak)
- Evidence Levels Vary by Question Type: Therapeutic, Prognostic, Diagnostic questions have different hierarchies
- Study Design ≠ Evidence Quality: A poorly conducted RCT can be downgraded; a well-done cohort can provide strong evidence
- Recommendation Strength: Depends on evidence quality, benefit-harm balance, values, and resource use
- “RCT is not always Level I - must meet quality criteria including blinding, adequate power, low attrition
- “Systematic review quality depends on included studies - SR of poor RCTs is not Level I
- “For rare outcomes, well-designed case-control may be best available evidence
- “GRADE separates evidence quality from recommendation strength - can have strong recommendation from low-quality evidence if large effect and ethical imperative
Overview and Introduction
Levels of evidence rank study designs in a hierarchy so that a clinician can appraise the strength of the evidence behind a clinical decision. The higher the level, the greater the confidence the findings deserve.
The hierarchy. Systematic reviews and meta-analyses sit at the top, randomised controlled trials next, cohort and case-control studies in the middle, and case series, case reports and expert opinion at the bottom.
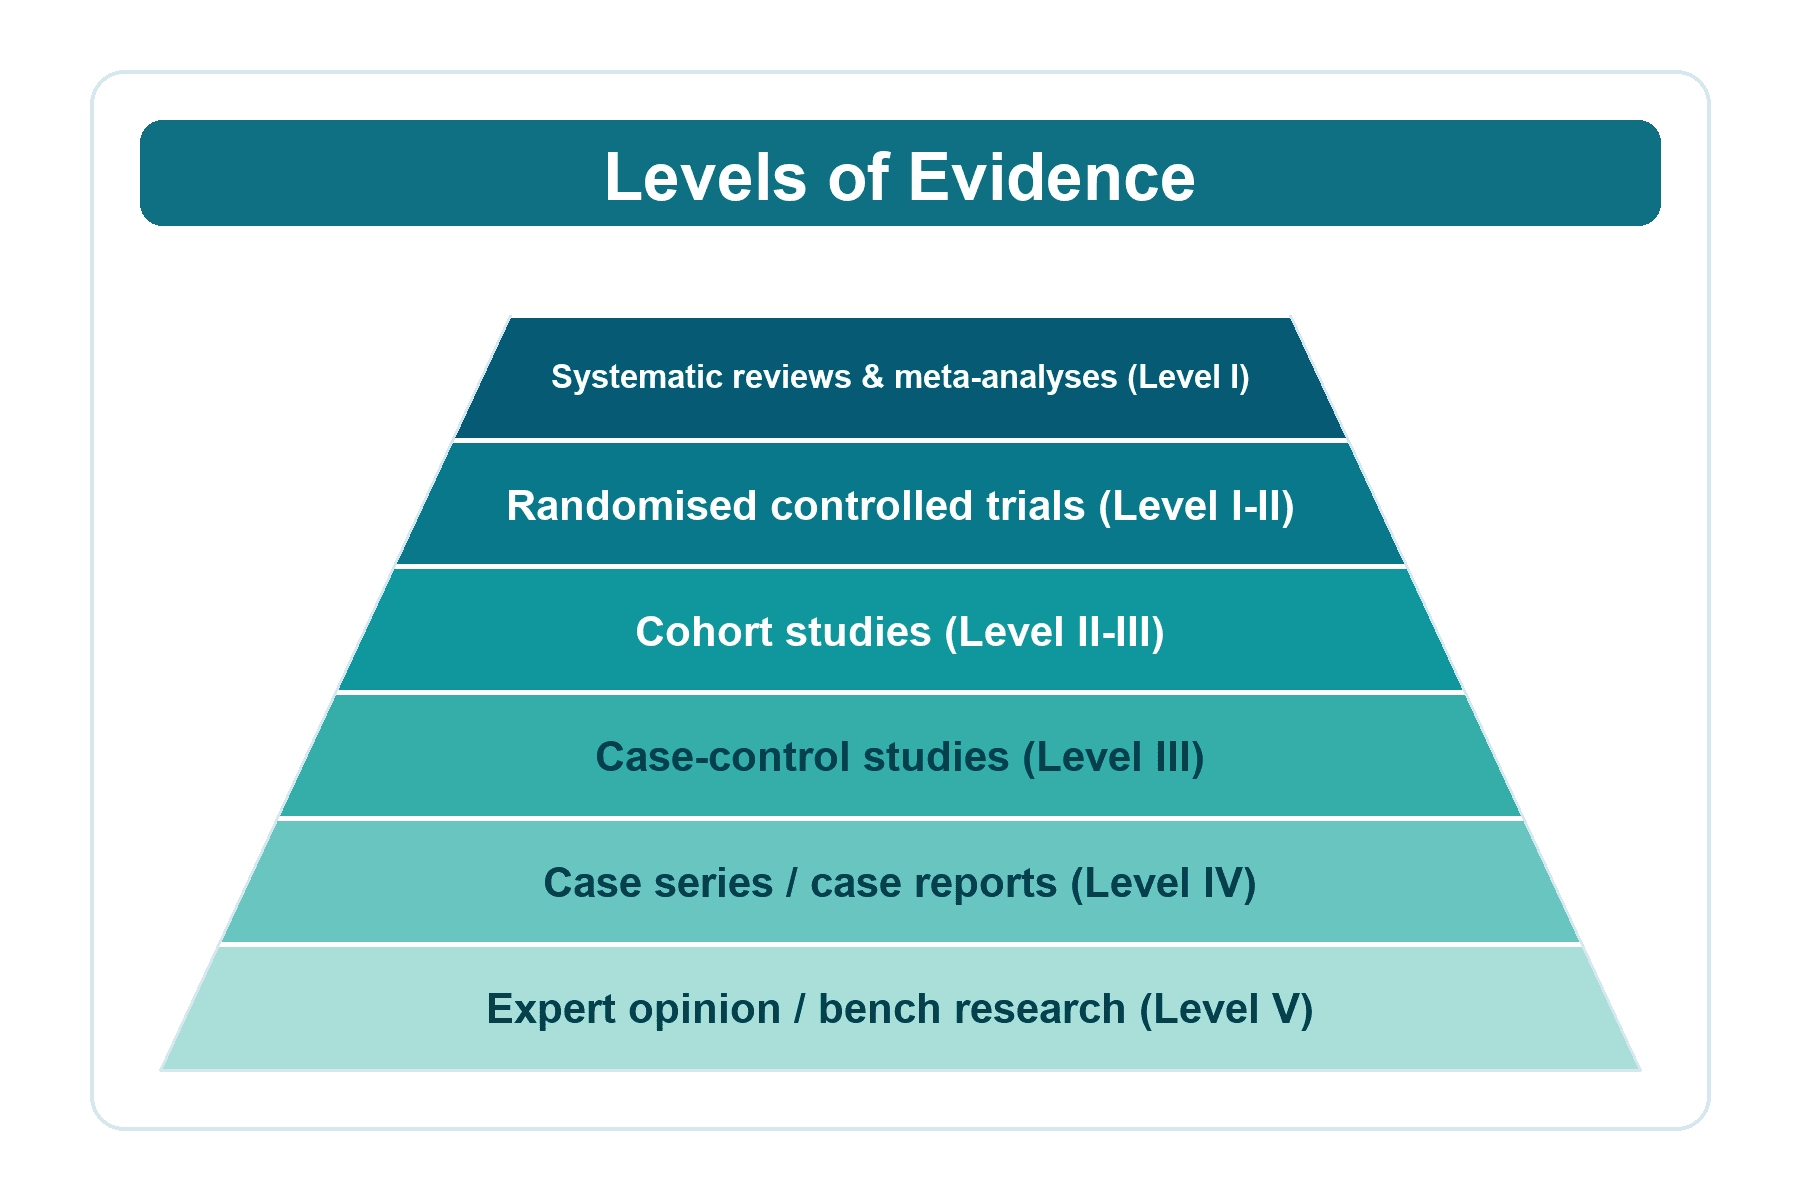
Why the label is only a start. Study design alone does not determine the evidence level. The quality of the randomisation, the blinding, the power, the attrition and the risk of bias must all be assessed, and a poorly conducted RCT may be downgraded to Level II or III. Different question types have different hierarchies, and the context of the decision determines which level of evidence is appropriate for it.
Concepts and Methodology Principles
Why design matters. The designs rank as they do because of what each feature guards against. Randomisation controls for known and unknown confounders and eliminates selection bias, which is why it is critical for therapeutic questions. Blinding prevents performance and detection bias, a control group allows the effect of the intervention to be compared, and a prospective design avoids recall and selection bias.
Study Hierarchies for Different Question Types
The hierarchy is not one table but several, because the design that answers a question best depends on the question. For a therapeutic question the RCT is the gold standard, for a prognostic question the cohort study is best, and for a diagnostic question it is a cross-sectional study against a reference standard.
A therapeutic question asks about treatment effectiveness: in [population], does [intervention] compared to [control] improve [outcome]?
- Study Design
- High-quality RCT or SR of Level I RCTs
- Quality Criteria
- Randomization, allocation concealment, blinding, greater than 80% follow-up, ITT analysis
- Example
- HEALTH trial: THA vs Hemi for femoral neck fracture
- Study Design
- Lesser-quality RCT, Prospective Cohort, SR of Level II
- Quality Criteria
- RCT with methodological flaws OR well-designed cohort
- Example
- Registry study comparing surgical approaches
- Study Design
- Case-Control, Retrospective Cohort
- Quality Criteria
- Observational with comparison, prone to confounding
- Example
- Case-control of AVN risk factors
- Study Design
- Case Series
- Quality Criteria
- No comparison group, descriptive only
- Example
- Series of 50 arthroscopic rotator cuff repairs
- Study Design
- Expert Opinion
- Quality Criteria
- Lowest level, based on experience
- Example
- Editorial on surgical technique preferences
GRADE System
What GRADE is. GRADE (Grading of Recommendations Assessment, Development and Evaluation) is the most widely used system for assessing evidence quality and recommendation strength. It produces two separate outputs:
- Quality of evidence: High, Moderate, Low or Very Low, which answers how confident we are in the effect estimate
- Strength of recommendation: Strong or Weak, for or against, which answers whether we should do this
Why the separation matters. Quality and strength are separate judgements. A strong recommendation can arise from lower-quality evidence when the effect is large and the harms are minimal.
Rating the quality. Start with the study design, then apply the modifiers. An RCT starts as high quality and an observational study as low; the rating is then downgraded for risk of bias, inconsistency, indirectness, imprecision and publication bias, and upgraded for a large effect, a dose-response relationship, or residual confounding that favours the null.
- Downgrade For
- Risk of bias, Inconsistency, Indirectness, Imprecision, Publication bias (each -1 or -2)
- Upgrade For
- Large effect, Dose-response, Residual confounding (each +1)
- Final Quality
- High / Moderate / Low / Very Low
- Downgrade For
- Same downgrade factors as above
- Upgrade For
- Same upgrade factors, often applied to cohort studies
- Final Quality
- Can upgrade to Moderate or even High with large effect
RIIIPGRADE Factors that Downgrade Evidence
Hook:RIIIP evidence apart - five factors that lower your confidence in the evidence!
Worked examples. An RCT with a high risk of bias (-1) and wide confidence intervals (-1) drops two levels, from High to Low quality evidence. A cohort study with a very large effect (+2) rises two levels, from Low to High quality evidence.
Critical Appraisal: Risk-of-Bias and Reporting Tools
The evidence level is a starting label. The next step is to appraise the individual study with the validated instrument matched to its design, keeping two kinds of instrument apart: a risk-of-bias (appraisal) tool appraises the study itself, while a reporting checklist governs how it is reported.
- Risk-of-bias / appraisal tool
- Cochrane Risk of Bias 2 (RoB 2)
- Reporting checklist
- CONSORT
- Risk-of-bias / appraisal tool
- ROBINS-I
- Reporting checklist
- STROBE / TREND
- Risk-of-bias / appraisal tool
- Newcastle-Ottawa Scale (selection, comparability, outcome/exposure)
- Reporting checklist
- STROBE
- Risk-of-bias / appraisal tool
- QUADAS-2
- Reporting checklist
- STARD
- Risk-of-bias / appraisal tool
- AMSTAR-2 (methodological quality of the review)
- Reporting checklist
- PRISMA
A study can be well reported (CONSORT-compliant) yet still at high risk of bias.
Distinguishing Study Designs (Differential)
A common exam task is to be handed a study description and asked to name the design, its level and its dominant bias. The direction of the study and the presence of a comparison group tell the designs apart quickly.
- Direction
- Prospective, allocation by chance
- Comparison group
- Yes - randomised arms
- Best for
- Therapeutic (treatment effect)
- Dominant bias / limitation
- Attrition and lack of blinding can downgrade; may lack external validity
- Direction
- Forward in time from exposure
- Comparison group
- Yes - exposed vs unexposed
- Best for
- Prognosis, harm, natural history
- Dominant bias / limitation
- Confounding; loss to follow-up
- Direction
- Backward using existing records
- Comparison group
- Yes - exposed vs unexposed
- Best for
- Harm with long latency
- Dominant bias / limitation
- Confounding and data-quality / measurement bias
- Direction
- Backward from outcome to exposure
- Comparison group
- Yes - cases vs controls
- Best for
- Rare outcomes, multiple exposures
- Dominant bias / limitation
- Recall and selection bias; gives odds ratio not risk
- Direction
- Single time point
- Comparison group
- Sometimes
- Best for
- Prevalence, diagnostic accuracy
- Dominant bias / limitation
- Cannot establish temporality
- Direction
- Descriptive, no comparator
- Comparison group
- No
- Best for
- Hypothesis generation, rare conditions
- Dominant bias / limitation
- No control - cannot infer causation; selection bias
Case-control yields an odds ratio and starts from the outcome; cohort yields relative risk and starts from the exposure. If there is no comparison group at all, it is a case series (Level IV) no matter how many patients are included.
Reading a Meta-Analysis: Forest Plots and Heterogeneity
Because the systematic review and meta-analysis sit at the apex of the pyramid, the examiner expects you to interpret one: the forest plot, the heterogeneity statistic, the choice of model and the funnel plot.
The forest plot. Each row is one study. The box is its point estimate, sized in proportion to the study's weight, and the horizontal whiskers are its confidence interval. The diamond is the pooled estimate: its centre is the value and its width the confidence interval.
The line of no effect. The vertical line marks the null value, a relative risk or odds ratio of 1 or a mean difference of 0. A confidence interval that crosses it is non-significant, and a diamond touching it is non-significant too.
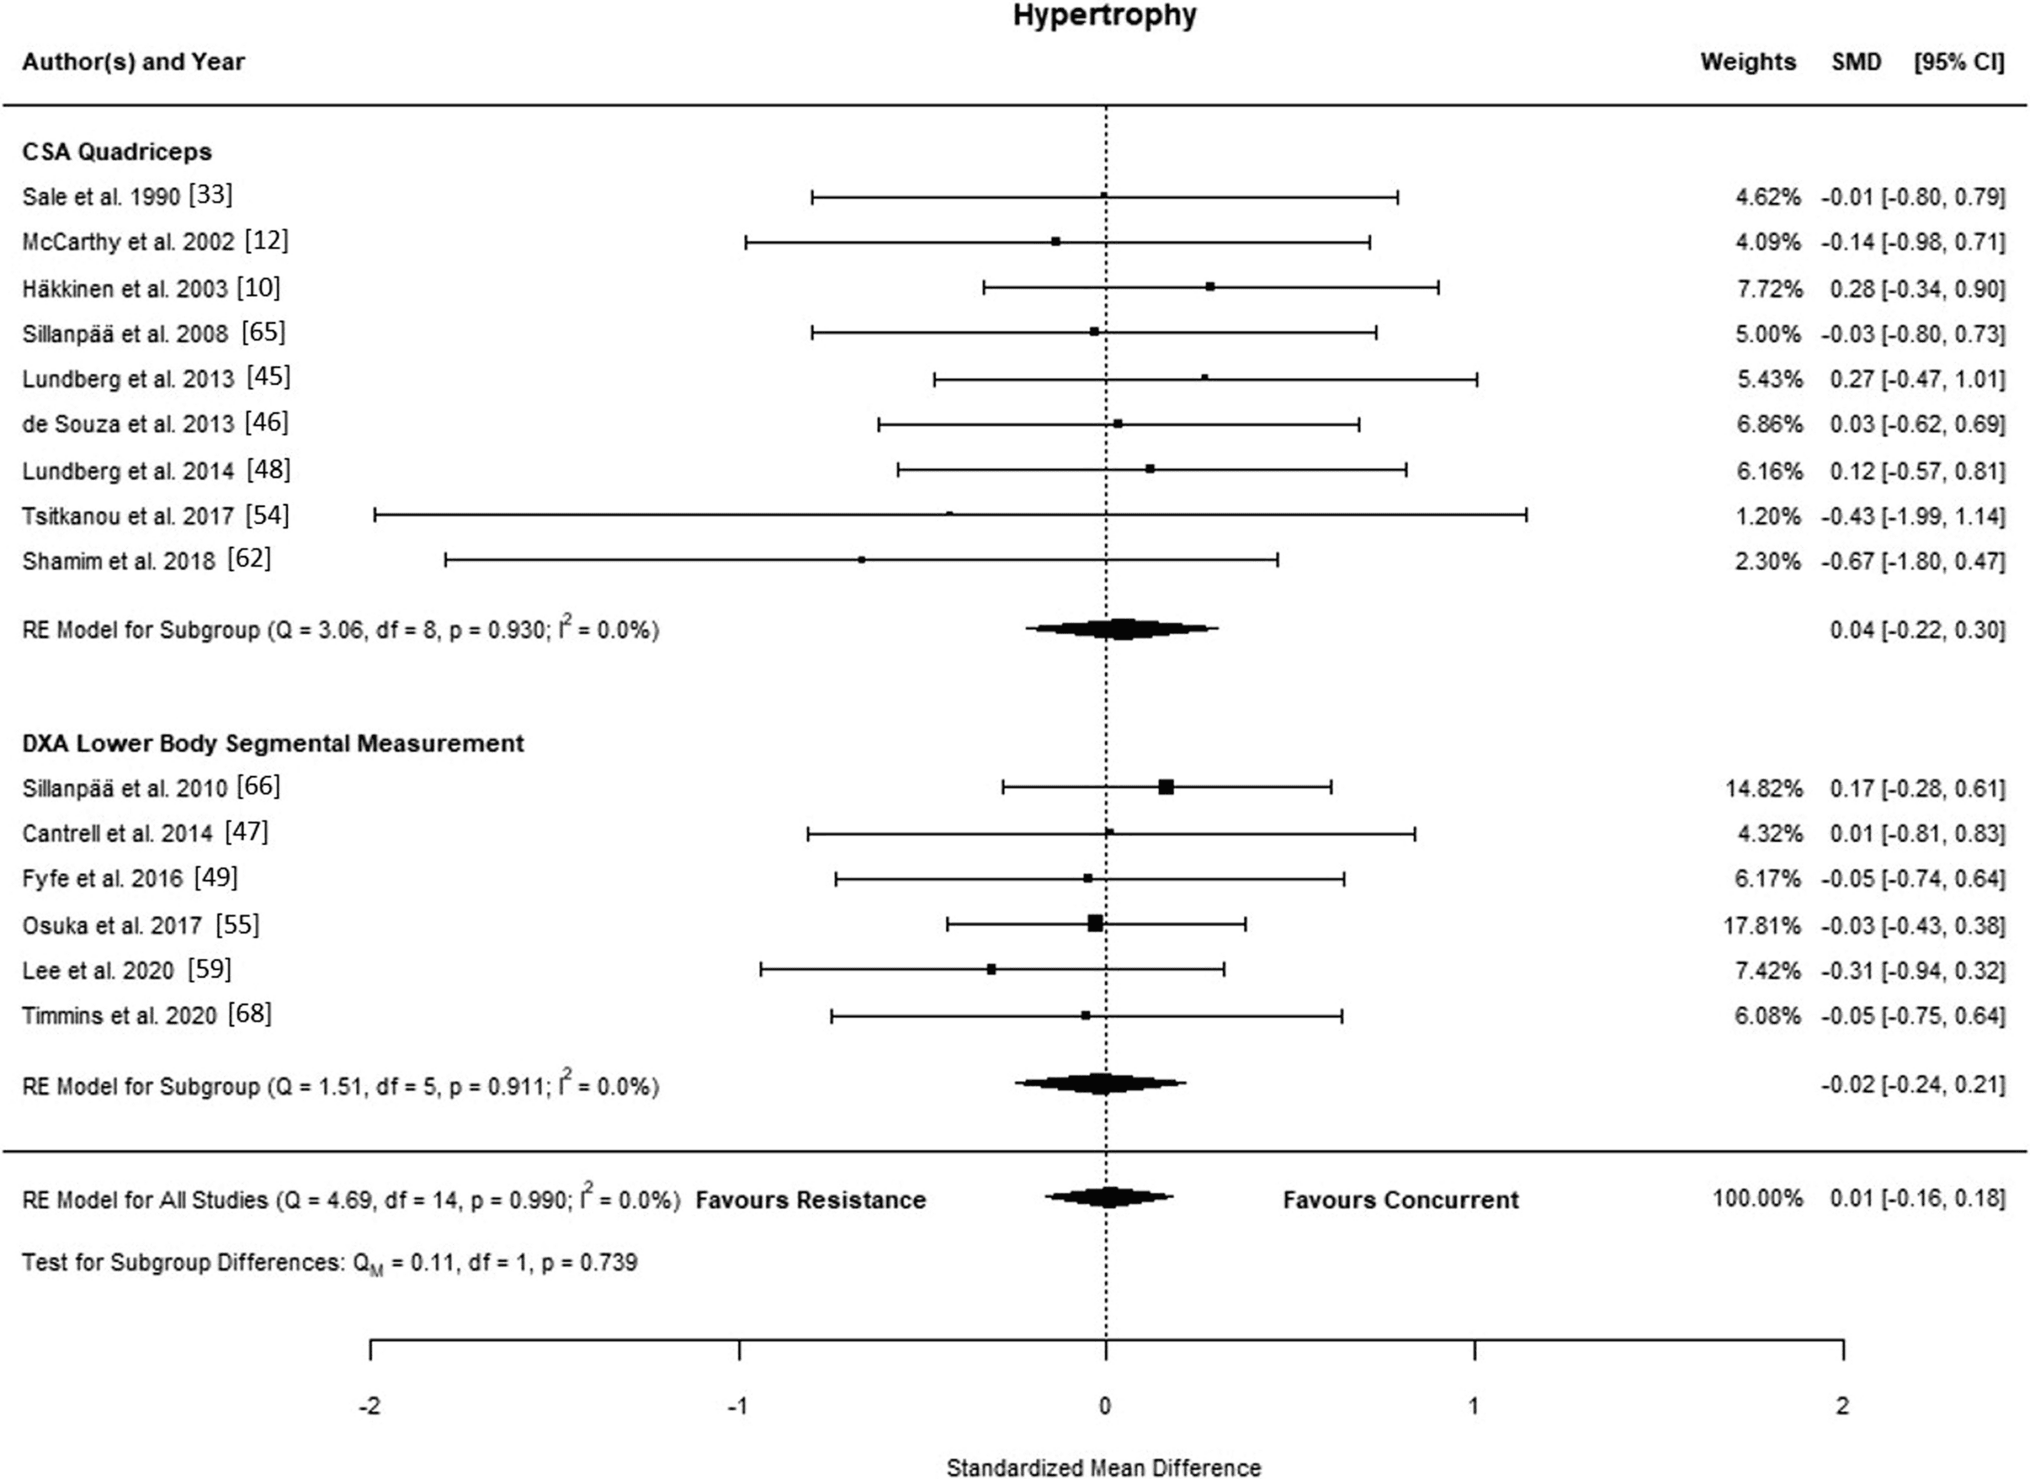
Heterogeneity. I-squared is the proportion of variability that is due to between-study differences rather than chance: roughly under 25% is low, about 50% moderate and over 75% high. High heterogeneity means the studies disagree, and a single pooled estimate may mislead.
Fixed versus random effects. A fixed-effects model assumes one common true effect and suits low heterogeneity. A random-effects model assumes a distribution of true effects, gives a wider confidence interval, and is the model to prefer when heterogeneity is high.
The funnel plot. Plotting each effect estimate against its precision screens for small-study effects and publication bias. A symmetric inverted funnel is reassuring; asymmetry suggests missing small negative studies.
A meta-analysis is only Level I if the studies it pools are sound.
Clinical Relevance and Applications
Applying evidence to the patient. Level I evidence is ideal but not always applicable to the person in front of you. Before acting on a trial, ask:
- Does the patient match the RCT inclusion criteria?
- Were the exclusion criteria too strict?
- Do the patient's values align with the outcomes studied?
When lower evidence is acceptable. Level III-IV evidence may suffice when:
- The disease is rare and no RCT is feasible
- The clinical need is urgent and cannot wait for an RCT
- Ethical constraints prevent randomisation
- Observational data are consistent and show large effects
Reading guidelines critically. A guideline should cite the evidence level for each recommendation. A strong recommendation based on weak evidence is a prompt to question the rationale.
Communicating uncertainty. Be honest with patients: if the evidence is Level IV, explain the uncertainty. Shared decision-making is crucial when the evidence is weak.
Guidelines, Registries & Global Practice
Evidence-Grading Systems Used Worldwide
Different bodies grade evidence and recommendations differently. Knowing which system a guideline uses is essential to interpret its recommendations correctly across examination jurisdictions.
- Region
- Global (WHO, Cochrane, NICE, BOA)
- What it grades
- Evidence quality + recommendation strength
- Key feature
- Separates confidence in estimate from should-we-act; most widely adopted
- Region
- UK / international
- What it grades
- Design-based level by question type
- Key feature
- Separate tables for treatment, diagnosis, prognosis, screening
- Region
- Orthopaedic journals globally
- What it grades
- Study design level (therapeutic/prognostic/diagnostic/economic)
- Key feature
- Article-label convention; level shown in abstract
- Region
- USA
- What it grades
- Strength of recommendation (Strong/Moderate/Limited/Consensus)
- Key feature
- Built on systematic review with explicit appraisal
- Region
- UK
- What it grades
- GRADE-based evidence and recommendation grading
- Key feature
- Health-economic modelling integrated into recommendations
Side-by-Side Society Approaches
- AAOS (US) publishes CPGs and Appropriate Use Criteria, rating each recommendation Strong, Moderate, Limited, or Consensus based on the quality and consistency of the underlying evidence.
- BOA / BOAST (UK) standards are pragmatic, consensus-and-evidence based, and increasingly cite GRADE-rated NICE guidance where available.
- AO Foundation education and guidance are largely expert-consensus and principle-based, explicitly acknowledging limited Level I evidence for many fracture-fixation decisions.
- EFORT / European national societies generally follow GRADE methodology for formal guidelines while recognising registry data as key observational evidence.
Registry Evidence as High-Quality Observational Data
Large arthroplasty registries are the prime real-world example of observational evidence that can be upgraded under GRADE (very large sample, consistent effects):
- AOANJRR (Australia), NJR (England, Wales, NI and IoM), AJRR (US), Swedish (SHAR) and Norwegian registries provide implant-survival and revision-rate data that no RCT could feasibly generate.
- Registry signals (for example, early failure of specific implant designs) have changed practice faster than trials could, illustrating when robust observational data legitimately drives strong recommendations.
- Limitations remain: confounding by indication, surgeon and patient selection, and outcome restricted largely to revision rather than patient-reported outcomes.
High- vs Limited-Resource Practice Variation
- In high-resource settings, guideline-concordant care can rely on RCTs, meta-analyses, and registry feedback loops.
- In limited-resource settings, Level I evidence may be unavailable or non-applicable (different implants, case-mix, and follow-up capacity); well-conducted local cohorts and pragmatic adaptation of global guidelines are appropriate.
- The principle is constant worldwide: integrate the best available external evidence with clinical expertise and patient values rather than apply a single hierarchy mechanically.
Why This Matters in the Exam
- Levels of evidence and GRADE are core research-methodology topics across all major fellowship exams.
- Vivas commonly test the ability to assign a level to a described study, identify its dominant bias, and apply the RIIIP downgrade factors.
- Examiners expect candidates to translate an evidence level into a defensible treatment recommendation, acknowledging uncertainty when evidence is weak.
Controversies and Areas of Uncertainty
Is the design hierarchy too rigid? Concato and colleagues (NEJM 2000) showed that well-designed observational studies did not systematically overestimate effects versus RCTs. GRADE responded by allowing observational data to be upgraded, but how large an effect justifies upgrading remains a judgement call.
Does a Level I label mean high quality? Poolman and Bhandari (2006) found that Level I and Level II orthopaedic RCTs had similar, often low, reporting-quality scores. The label is a starting point; the individual methodological safeguards must still be appraised.
External validity. Strict inclusion criteria, expert centres and protocolised follow-up can make trial populations unrepresentative. Efficacy in a trial is not always effectiveness in routine practice, which is where pragmatic trials and registries add value.
Feasibility of the surgical RCT. Blinding surgeons is impossible, sham surgery is ethically fraught, learning curves bias early results, and equipoise is often lacking. This is why much high-quality orthopaedic evidence is necessarily observational.
MCQ Practice Points
Q: Which of the following is required for an RCT to be considered Level I evidence? A: All of the following: Adequate randomization and allocation concealment, blinding of participants and assessors, intention-to-treat analysis, less than 20 percent loss to follow-up, and adequate sample size with power calculation. A poorly conducted RCT with high attrition or lack of blinding is downgraded to Level II.
Q: What are the five factors that downgrade evidence quality in the GRADE system? A: RIIIP: Risk of bias, Inconsistency (heterogeneity across studies), Indirectness (PICO mismatch), Imprecision (wide confidence intervals), and Publication bias. Each factor can downgrade by 1 or 2 levels.
Q: What is the best study design for answering a prognostic question about fracture healing? A: Prospective cohort study. For prognostic questions, cohort studies are superior to RCTs because you follow natural history without intervention. RCTs are best for therapeutic questions, not prognosis.
Exam Viva Scenarios
Practise clinical reasoning and management decisions out loud
“A colleague shows you a case series of 30 patients who underwent a new surgical technique for rotator cuff repair, with 90 percent good outcomes at 2 years. He says this is Level I evidence. How would you respond?”
“You are reviewing a guideline that gives a Strong recommendation for surgical fixation of ankle fractures based on Moderate quality evidence from observational studies. Is this appropriate?”
“An examiner says: 'A registry of 200,000 hip replacements shows one cemented stem has a much higher revision rate than its competitors. A trainee argues this should be ignored because it is only Level II observational data and we have no RCT. How do you respond, and how would you design the ideal study?'”
Evidence Levels (Therapeutic)
- Level I = High-quality RCT or SR of RCTs
- Level II = Lesser RCT or Prospective Cohort
- Level III = Case-Control or Retrospective Cohort
- Level IV = Case Series (no control)
- Level V = Expert Opinion (lowest)
Question-Specific Best Evidence
- Therapeutic question = RCT gold standard
- Prognostic question = Cohort study best
- Diagnostic question = Cross-sectional with reference standard
- Economic question = Cost-effectiveness analysis
- Hierarchy differs by question type
GRADE System
- GRADE assesses quality (High/Moderate/Low/Very Low) AND strength (Strong/Weak)
- Start with RCT = High quality; Observational = Low quality
- Downgrade for: RIIIP (Risk, Inconsistency, Indirectness, Imprecision, Publication bias)
- Upgrade for: Large effect, Dose-response, Residual confounding
- Strong recommendation can come from moderate evidence if large effect
Level I Criteria (RCT)
- Adequate randomization and allocation concealment
- Blinding of participants and assessors
- Intention-to-treat analysis
- Less than 20% loss to follow-up
- Adequate power (sample size calculation)
Common Pitfalls
- RCT design does NOT automatically equal Level I (must meet quality criteria)
- SR quality depends on included studies (SR of poor RCTs is not Level I)
- Case-control overestimates diagnostic test accuracy (spectrum bias)
- Cannot establish causality from case series (no comparison group)
- Observational studies CAN provide high-quality evidence if very large effect
Evidence Base
Introducing Levels of Evidence to the Journal (JBJS framework)
- Editorial that formally introduced the levels-of-evidence rating system to JBJS (vol 85-A, p1-3)
- Adapted the system to provide separate hierarchies for therapeutic, prognostic, diagnostic, and economic/decision-analysis questions
- Defined Level I as high-quality RCT or systematic review of Level I RCTs, descending to Level V (expert opinion)
- Adopted as a journal policy requiring an evidence level to accompany each clinical article
GRADE: An Emerging Consensus on Rating Quality of Evidence and Strength of Recommendations
- Landmark consensus article describing the GRADE approach to rating evidence and recommendations
- Separates quality of evidence (High/Moderate/Low/Very Low) from strength of recommendation (Strong/Weak)
- RCTs start as high quality and observational studies as low, then move up or down on explicit criteria
- Now adopted by the WHO, Cochrane, NICE, and over 100 organisations worldwide
Randomized, Controlled Trials, Observational Studies, and the Hierarchy of Research Designs
- Compared meta-analyses of RCTs with meta-analyses of cohort/case-control studies on the same five clinical topics (99 reports)
- Well-designed observational studies did NOT systematically overestimate treatment effects versus RCTs
- Point estimates were similar (e.g. BCG vaccine: RCT relative risk 0.49 vs case-control odds ratio 0.50)
- The range of estimates was actually wider for the RCTs than the observational studies
Does a Level I Evidence Rating Imply High Quality of Reporting in Orthopaedic RCTs?
- Assessed 32 RCTs in JBJS-Am (2003-2004, 3543 patients) using the Cochrane reporting-quality tool
- Studies labelled Level I and Level II had low and statistically indistinguishable reporting-quality scores
- Item-level correlations between evidence level and reporting quality ranged from only 0.0 to 0.2
- Concluded a Level I label does NOT guarantee high methodological reporting quality
CONSORT 2010 Statement: Updated Guidelines for Reporting Parallel Group Randomised Trials
- Provides the internationally endorsed 25-item checklist and flow diagram for reporting RCTs
- Specifies reporting of randomisation, allocation concealment, blinding, and participant flow
- Used by journals worldwide as a condition of publication for randomised trials
- Directly maps to the quality criteria distinguishing a true Level I RCT from a downgraded one
Evidence Based Medicine: What It Is and What It Isn't
- Seminal editorial defining evidence-based medicine as integrating best external evidence with clinical expertise and patient values
- Clarified that EBM is not 'cookbook' medicine and does not ignore individual clinical judgement
- Emphasised that the best external evidence may come from designs other than RCTs depending on the question
- Established the conceptual foundation on which evidence hierarchies and GRADE were later built