False Positives | False Negatives | Error Rates
- Type I Error (Alpha): Concluding there IS an effect when there is NOT (false positive). Set before study, usually 0.05.
- Type II Error (Beta): Concluding there is NO effect when there IS (false negative). Related to power: Power = 1 minus Beta.
- Trade-off: Reducing alpha (e.g., 0.01) reduces Type I error but increases Type II error risk unless sample size increases.
- Clinical Consequences: Type I leads to adopting ineffective treatments; Type II leads to discarding effective treatments.
- Multiple Comparisons: Testing many hypotheses inflates the family-wise Type I error - but be careful how you phrase the remedy, because the paper cited on this page is titled What's wrong with Bonferroni adjustments. A pre-specified PRIMARY outcome needs no adjustment; blanket correction of everything is over-conservative, buys the Type I reduction with Type II error, and rests on an arbitrary decision about what counts as the 'family' of tests. Pre-specify one primary outcome and report the rest as exploratory with effect sizes.
- “Alpha is set BEFORE study (usually 0.05), p-value is calculated AFTER from data
- “Underpowered studies have high Type II error risk - may miss real treatment effects
- “Type I error is considered worse in many contexts - adopting harmful treatment worse than missing beneficial one
- “Multiple testing without correction can inflate Type I error above 0.05
Overview and Definitions
Every hypothesis test ends in a decision taken without knowing the truth, so it can go wrong in two ways. A Type I error finds a difference that does not exist; a Type II error misses one that does.
Type I error, the false positive. Rejecting the null hypothesis when the null is actually true: concluding, for example, that a new surgical technique is superior when it has no benefit. Its probability is alpha, set before the study and usually 0.05, which accepts a 5% risk. Acting on a false positive means:
- Adopting an ineffective or harmful treatment
- Wasting resources implementing the change
- Potential harm to patients
- False confidence in the intervention
Type II error, the false negative. Failing to reject the null hypothesis when the alternative is actually true: concluding that two treatments are equivalent when one is superior. Its probability is beta, conventionally 0.20, and power is 1 minus beta, so the conventional 80% power accepts a 20% risk. Acting on a false negative means:
- Discarding an effective treatment
- Delaying progress in patient care
- Wasted research effort in a failed trial
- Missing a therapeutic opportunity
A memory aid. The Boy Who Cried Wolf. A Type I error is crying wolf falsely, a false alarm; a Type II error is missing the real wolf.
Alpha is not the p-value. Alpha is set before the study; the p-value is calculated after, from the data. If p is less than alpha the null is rejected, and if the null was in fact true, that rejection is a Type I error.
Error Matrix and Decision Framework
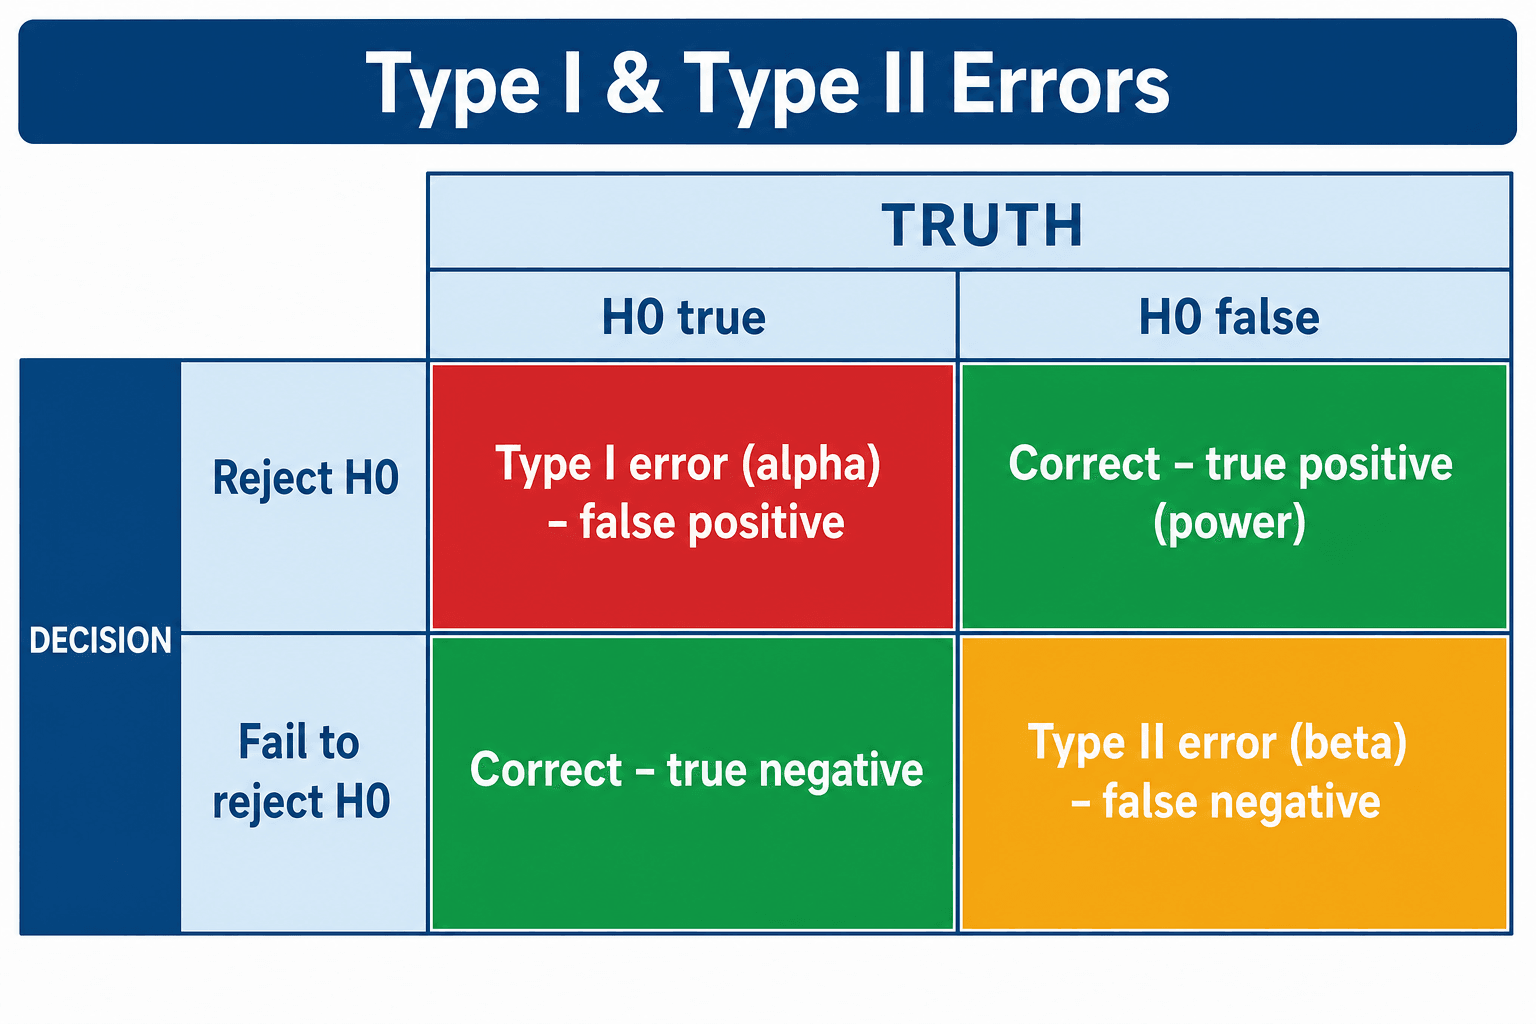
Four outcomes, two of them errors. Crossing the decision against the truth gives four cells. A Type I error sits at rate alpha and a Type II error at rate beta; the correct decisions are the true negative, at 1 minus alpha, and the true positive, which is power.
We never know which column we are in. The true state of nature is unknown. What the investigator sets is alpha and beta, and they control the error rates.
A worked example. A trial tests whether a new implant reduces the revision rate compared with a standard implant. The null hypothesis (H₀) is no difference in revision rates; the alternative (H₁) is that the new implant has a lower revision rate. Each conclusion carries its own cost if the truth lies in the other column.
- If H₀ is TRUE (no real difference)
- TYPE I ERROR - Adopt new implant unnecessarily, higher cost for no benefit
- If H₁ is TRUE (new implant better)
- CORRECT - Adopt superior implant, improve patient outcomes
- If H₀ is TRUE (no real difference)
- CORRECT - Continue with standard implant, avoid unnecessary change
- If H₁ is TRUE (new implant better)
- TYPE II ERROR - Miss opportunity to improve outcomes, continue inferior treatment
The Alpha-Beta Trade-off
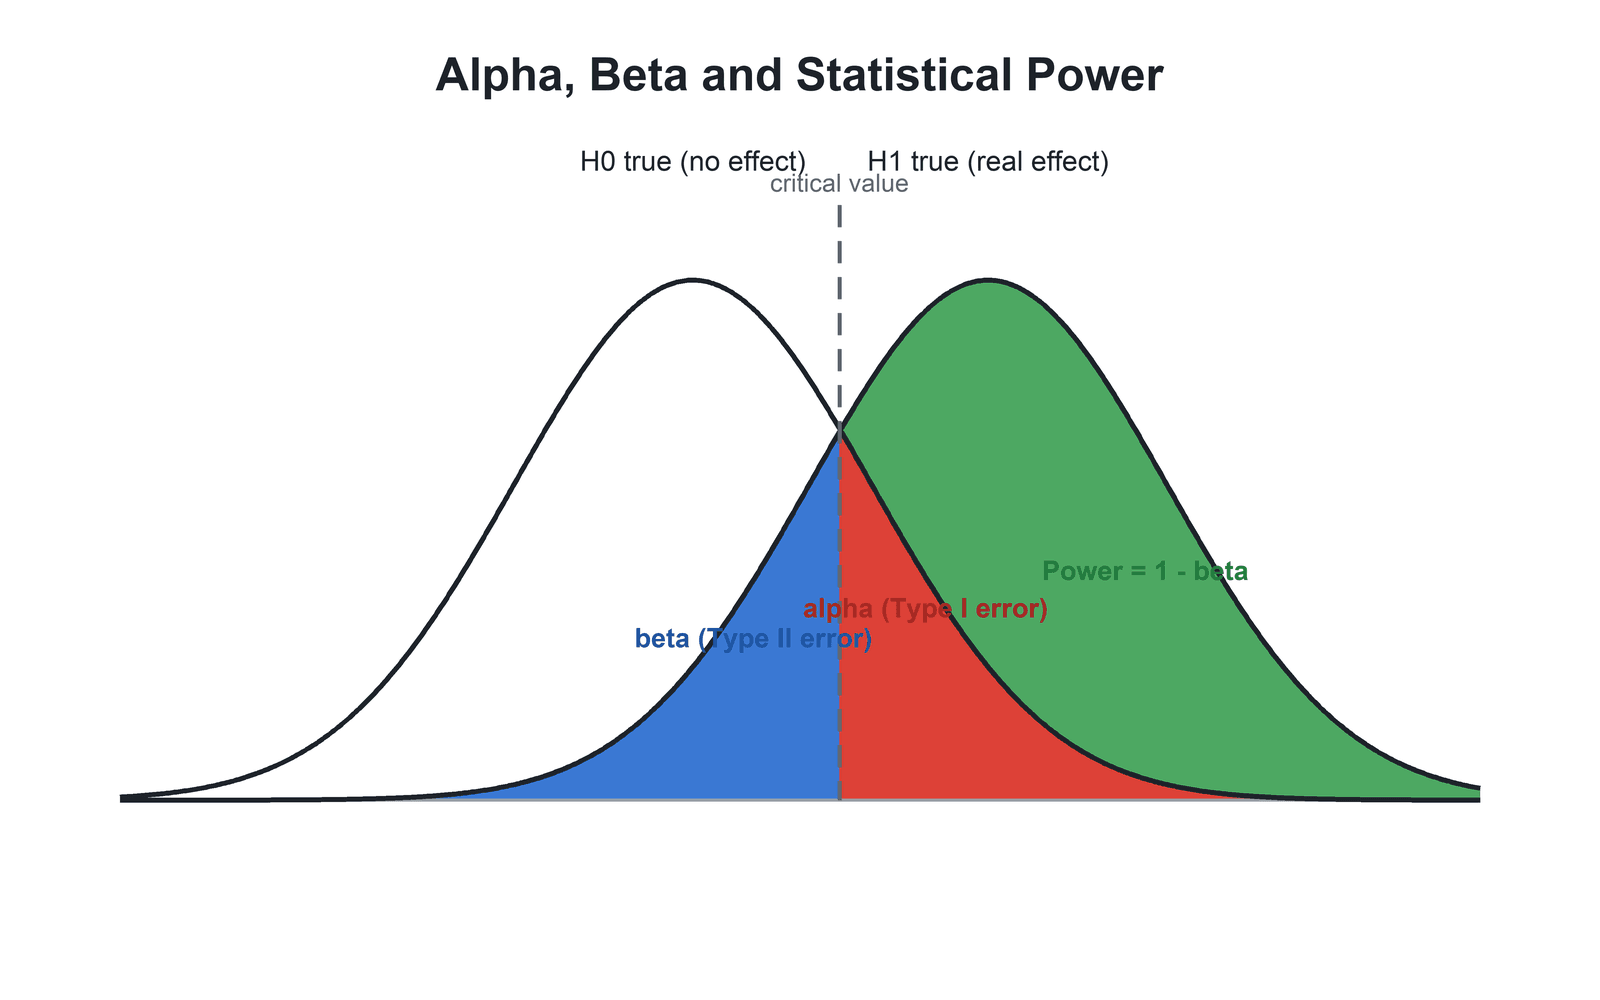
The trade-off. With a fixed sample the two errors cannot both be minimised. Lowering alpha, say to 0.01, reduces Type I error but increases the risk of Type II error unless the sample size increases, and reducing Type II error by raising power increases the sample size needed. A larger sample reduces both errors, though it mainly acts on Type II.
Choosing alpha. The threshold moves with the setting, and each choice is paid for in sample size or in the other error.
- Type I Error Risk
- 1% false positive rate
- When Used
- When Type I error is very costly (e.g., drug approval)
- Trade-off
- Requires larger sample or accepts higher Type II error
- Type I Error Risk
- 5% false positive rate
- When Used
- Conventional in most research
- Trade-off
- Balance between Type I and Type II errors
- Type I Error Risk
- 10% false positive rate
- When Used
- Exploratory or pilot studies
- Trade-off
- Easier to find significance but higher false positive risk
Controlling each error. Type I error is controlled by pre-specifying alpha and by appropriate correction for multiple testing. Type II error is controlled by an adequate sample size built on appropriate effect-size assumptions.
Which error is worse? It depends on context: the severity of the disease and the risks of the treatment. A Type I error is often considered worse, because it adopts a harmful treatment, but a Type II error can be worse if it misses a life-saving one. Type I is the more serious when the treatment is invasive, the decision irreversible or the intervention expensive; Type II is the more serious when a life-saving treatment is missed, or in a rare disease with few options.
Screening tests. A false positive brings unnecessary workup and anxiety; a false negative brings a missed diagnosis and delayed treatment. For serious diseases such as cancer, screening prioritises minimising Type II error, which means high sensitivity.
Type II Error and Power
Power. Power is 1 minus beta, the chance of detecting a real effect. The conventional target is 80%, and every step above it costs sample size.
- Power
- 95%
- Interpretation
- Very high power - 95% chance detecting real effect
- Sample Size
- Very large sample needed
- Power
- 90%
- Interpretation
- High power - 90% chance detecting real effect
- Sample Size
- Large sample needed
- Power
- 80%
- Interpretation
- Adequate power - 80% chance detecting real effect
- Sample Size
- Moderate sample, conventional target
- Power
- 50%
- Interpretation
- Underpowered - coin flip chance of detection
- Sample Size
- Small sample, high Type II error risk
Underpowered orthopaedic trials. Many orthopaedic trials are underpowered, with power under 80% and beta greater than 0.20, so their negative results may be Type II errors. Always check the a priori power calculation before accepting a negative result.
Low power also undermines the significant results. Power is usually taught as protection against missing a true effect, and that is the smaller half of it. Alpha fixes how often a false positive arises among true nulls, but the proportion of significant findings that are real depends on power as well.
Why. With power at 0.20 a true effect is detected one time in five, while false positives keep arriving at their usual rate, so a larger share of the significant results in that literature are wrong. A p value below 0.05 from an underpowered study is weaker evidence than the same p from a well-powered one, which is not something the p-value itself tells you.
The winner's curse. In an underpowered study only an unusually large observed effect will clear the significance threshold, so the effects that reach print are systematically exaggerated. This is why small early trials so often fail to replicate and why meta-analyses shrink toward smaller effects over time. The same mechanism explains why trials stopped early for benefit overstate the treatment effect.
Who pays. Both consequences fall on the reader, not the investigator. The investigator who runs an underpowered study risks a null result; the literature inherits exaggerated positives.
Post-hoc power. Power calculated after a non-significant result, using the observed effect, is meaningless: it is statistically circular, merely re-expresses the p-value, and can never explain a null result. Judge underpowering from the a priori calculation and the width of the confidence interval instead, and to know whether a negative trial excluded a worthwhile effect, read the confidence interval.
Meta-analysis. Pooling data from multiple studies increases power, which reduces the risk of Type II error and gives a more precise estimate of the effect.
Determinants of Power, Effect Size and the MCID
Four moving parts. Power is fixed by four interrelated determinants, and understanding them is how a sample-size calculation is actually performed. Fix any three and the fourth is determined; conventionally alpha, power and the target effect size are specified to solve for the required sample size.
- Effect on power
- A stricter alpha (e.g. 0.01) lowers power
- Practical note
- Tightening false-positive control costs power unless n rises
- Effect on power
- A larger true effect is easier to detect (more power)
- Practical note
- The clinically important difference you set out to detect
- Effect on power
- More variability lowers power
- Practical note
- Reduced by precise measurement and a homogeneous sample
- Effect on power
- A larger n raises power
- Practical note
- The lever the investigator most directly controls
Effect size. Effect size expresses the magnitude of a difference independently of sample size. For continuous outcomes it is the standardised mean difference (Cohen's d), the difference in means divided by the pooled standard deviation, conventionally about 0.2 small, 0.5 medium and 0.8 large. For proportions or risks it is the relative risk, odds ratio or absolute risk difference.
The MCID. The minimal clinically important difference is the smallest change a patient perceives as worthwhile. A trial should be powered to detect the MCID, not a trivial difference, and this is what links the statistics to clinical relevance.
The flip side, in registries. With a very large sample, a difference far smaller than the MCID can still reach p less than 0.05, so a "statistically significant" registry finding may be clinically meaningless. Always read the effect size and its confidence interval, never the p-value alone.
Multiple Comparisons and Type I Error Inflation
The multiple testing problem. Testing multiple hypotheses inflates the overall Type I error rate. Test 20 different outcomes at alpha 0.05 each and you expect 20 × 0.05 = one false positive on average, and the family-wise error rate (FWER), the probability of at least one Type I error, increases with each test.
The arithmetic. FWER = 1 minus (1 minus alpha)^n. For 20 tests at alpha 0.05 that is 1 minus 0.95^20 = 0.64, a 64% chance of at least one false positive.
Bonferroni correction. Divide alpha by the number of tests, so adjusted alpha = 0.05 / n, to maintain the overall Type I error. Testing five outcomes gives 0.05 / 5 = 0.01, and each test must then reach p less than 0.01 to hold the overall rate at 0.05. It is conservative, and may increase Type II error by reducing power.
Correct when testing multiple related hypotheses, such as multiple outcome measures in the same trial. A pre-specified primary outcome may not need correction: only the primary outcome requires alpha = 0.05, with secondary and exploratory outcomes corrected or interpreted cautiously.
How far to correct is contested. Whether and how to adjust is genuinely disputed, between Perneger and proponents of strict family-wise control. Perneger's paper is titled What's wrong with Bonferroni adjustments: blanket correction of everything is over-conservative, buys its Type I reduction with Type II error, and rests on an arbitrary decision about what counts as the "family" of tests.
The defensible middle ground. Pre-specify one primary outcome, which needs no adjustment, and treat everything else as hypothesis-generating, reported with effect sizes. Where correction is needed, correct thoughtfully (Holm, false discovery rate) rather than applying Bonferroni to everything.
Beyond Bonferroni: Other Corrections and Alpha-Spending
Less conservative corrections. Bonferroni is the simplest multiplicity correction but also the most conservative, and examiners frequently ask what else is available, because the alternatives sacrifice less power. Bonferroni, Holm and Hochberg control the family-wise error rate, the chance of even one false positive; Benjamini-Hochberg controls the false discovery rate instead.
- What it does
- Ranks the p-values and tests them sequentially against progressively less strict thresholds
- Relative to Bonferroni
- Uniformly more powerful while still controlling the family-wise error rate - generally preferred
- What it does
- Similar sequential logic working from the largest p-value down
- Relative to Bonferroni
- Slightly more powerful than Holm under mild assumptions
- What it does
- Adjusted alpha = 1 minus (1 minus alpha) raised to the power 1/n
- Relative to Bonferroni
- Marginally less conservative than Bonferroni for independent tests
- What it does
- Controls the expected proportion of false positives among the significant results, not the chance of any false positive
- Relative to Bonferroni
- Far more powerful; the standard for large-scale testing where some false positives are tolerable
Repeated looks over time: alpha-spending. Multiple interim analyses inflate the Type I error in the same way as multiple outcomes, so the total alpha must be spent across the looks using group-sequential boundaries:
- O'Brien-Fleming boundaries are very stringent early, making it hard to stop early and preserving alpha and power for the final analysis
- Pocock boundaries apply a constant, less stringent threshold at every look
Commonly Confused Concepts
These terms are repeatedly conflated in vivas and MCQs, and each has its classic trap.
- What it is
- Probability of a false positive when null is true
- Controls / measures
- Set a priori, usually 0.05
- Classic trap
- Confusing alpha (pre-set) with the p-value (data-derived)
- What it is
- Probability of a false negative when alternative is true
- Controls / measures
- Determined by power, effect size and sample size
- Classic trap
- Treating a non-significant result as proof of no effect
- What it is
- Probability of data this extreme if null were true
- Controls / measures
- Calculated from the observed data
- Classic trap
- Reading p as the probability the null is true
- What it is
- Chance of detecting a real effect of given size
- Controls / measures
- Increased by larger n, larger effect, lower variance
- Classic trap
- Reporting post-hoc power to explain a negative result
- What it is
- Range of plausible values for the true effect
- Controls / measures
- Width reflects precision (driven by sample size)
- Classic trap
- Ignoring a wide CI that crosses no-effect in a small study
- What it is
- Pre-defined limit within which treatments are deemed equal
- Controls / measures
- Specified before the study, with its own power
- Classic trap
- Claiming equivalence from a failed superiority trial (absence of evidence is not evidence of absence)
A non-significant superiority trial (p greater than 0.05) does NOT demonstrate equivalence. Demonstrating that two treatments are equivalent requires a purpose-designed equivalence or non-inferiority trial with a pre-specified margin and its own power calculation. Treating a Type II error as proof of "no difference" is one of the most common - and most penalised - errors in the viva.
Guidelines, Registries & Global Practice
Global Reporting Standards
Error control is enforced internationally through reporting and regulatory frameworks rather than country-specific rules - the concepts are universal across fellowship curricula.
- Scope
- Reporting of parallel-group RCTs
- Type I control
- Pre-specified primary outcome; declare subgroup/multiple analyses
- Type II control
- Mandatory sample-size justification (effect size, alpha, power)
- Scope
- Statistical principles for clinical trials
- Type I control
- Pre-defined analysis plan, multiplicity strategy, alpha spending
- Type II control
- Power and sample-size assumptions stated a priori
- Scope
- Drug and device approval (US / Europe)
- Type I control
- Often demands two adequate well-controlled trials or stricter alpha
- Type II control
- Adequate power required for pivotal endpoints
- Scope
- Evidence synthesis and certainty rating
- Type I control
- Meta-analysis reduces spurious single-study positives
- Type II control
- Pooling raises power; imprecision downgrades certainty
- Scope
- Observational study reporting
- Type I control
- Encourages reporting of all analyses to limit selective positives
- Type II control
- Reporting of study size and its rationale
Registries and Large Datasets
National joint replacement registries (NJR for England/Wales, AOANJRR Australia, SHAR Sweden, the Norwegian and New Zealand registries, and AJRR in the US) hold hundreds of thousands of procedures. Their value for this topic is power: rare events such as implant revision are detectable with adequate precision, dramatically reducing Type II error compared with single-centre series. The trade-off is that with such large samples, trivial differences become statistically significant, so the emphasis shifts to clinical significance and effect size (e.g. hazard ratios for revision) rather than the p-value alone.
High- vs Limited-Resource Practice Variation
- Typical reality
- Multicentre RCTs, registries, pre-registration
- Error implication
- Better powered; main risk is over-interpreting tiny but significant effects (Type I in spirit)
- Typical reality
- Small single-centre series, few RCTs
- Error implication
- High Type II error risk; negative results frequently inconclusive
- Typical reality
- Cochrane reviews pool across regions
- Error implication
- Improves power and generalisability; heterogeneity must be assessed
The teaching point is universal: interpret a "negative" study in the light of its power, and a "positive" study in the light of multiplicity and effect size - independent of country.
Controversies and Areas of Uncertainty
Should alpha stay at 0.05? A 2017 proposal argued for lowering the default threshold for new claims to 0.005 to curb false positives. Critics countered that this simply trades a higher Type I rate for a higher Type II rate and demands much larger samples. No global consensus exists, and 0.05 remains the working convention.
Abandon significance testing? Some statisticians advocate retiring the word "significant" altogether in favour of estimation (effect sizes with confidence intervals) and Bayesian reasoning. Exam answers should still command the classical framework but can acknowledge this debate.
MCQ Practice Points
Q: What is a Type I error? A: Rejecting null hypothesis when null is actually true (false positive). Concluding there IS a difference when there is NOT. Probability is alpha (usually 0.05 or 5%).
Q: What is a Type II error? A: Failing to reject null hypothesis when alternative is true (false negative). Concluding there is NO difference when there IS. Probability is beta (usually 0.20 or 20% for power = 80%).
Q: Why does testing multiple outcomes increase Type I error risk? A: Each test has 5% chance of false positive. Testing 20 outcomes means expecting 20 × 0.05 = 1 false positive on average. Family-wise error rate (probability of at least one false positive) increases with each additional test. Bonferroni correction divides alpha by number of tests to control overall Type I error.
Exam Viva Scenarios
Practise clinical reasoning and management decisions out loud
“A study concludes that a new fixation technique reduces nonunion rates compared to standard technique (p = 0.03). However, the new technique actually has the same nonunion rate as standard. What type of error has occurred?”
“You are reviewing an RCT that tested 10 different outcome measures. One outcome showed p = 0.04. How do you interpret this result?”
“A single-centre RCT of 40 patients compares a new locking plate with a standard plate for distal radius fractures and finds no significant difference in function (p = 0.28). The authors conclude the implants are equivalent. As the examiner asks: is that conclusion justified?”
Error Definitions
- Type I = False Positive = Reject null when null is true = Alpha
- Type II = False Negative = Accept null when alternative is true = Beta
- Power = 1 minus Beta = Probability of correctly rejecting false null
- Alpha set BEFORE study (usually 0.05), p-value calculated AFTER from data
- If p less than alpha, reject null (risk Type I if null actually true)
Error Consequences
- Type I consequence = Adopt ineffective or harmful treatment
- Type II consequence = Discard effective treatment, miss opportunity
- Type I often considered worse (false adoption) but context-dependent
- Screening: Type II worse for serious diseases (miss cancer)
- Treatment: Type I worse for risky interventions (adopt harmful therapy)
Error Control
- Reduce Type I = Lower alpha (0.01 instead of 0.05) OR increase sample
- Reduce Type II = Increase power (0.90 instead of 0.80) OR increase sample
- Trade-off: Lowering alpha increases beta unless sample increases
- Conventional: Alpha = 0.05 (5% Type I), Beta = 0.20 (20% Type II, 80% power)
- Large sample reduces both errors
Multiple Comparisons
- Testing n outcomes inflates Type I error (family-wise error rate)
- FWER = 1 minus (1 minus alpha)^n
- 20 tests at alpha 0.05: FWER = 64% (not 5%)
- Bonferroni correction: Adjusted alpha = 0.05 / n
- Primary outcome: No correction. Secondary outcomes: Correct or interpret cautiously
Clinical Application
- Underpowered studies have high Type II error risk (beta greater than 0.20)
- Negative result from underpowered study = Inconclusive, NOT definitive
- Pre-specify primary outcome to avoid multiple comparison issues
- Meta-analysis reduces Type II error by pooling studies (increases power)
- Always check power when interpreting negative results
Evidence Base
Type-II Error Rates of Randomised Trials in Orthopaedic Trauma
- Systematic review of 117 randomised fracture-care trials (1968 to 1999) enrolling 19,942 patients
- Mean study power for the primary outcome was only 24.65 percent (range 2 to 99 percent)
- Type-II (beta) error rate for primary outcomes was 90.52 percent - the great majority were underpowered
- Sample sizes were small and extraordinarily variable: mean 95 patients with a standard deviation of 79, range 10 to 662, and 34% of the trials concerned hip fractures
- Primary outcomes were often not pre-specified, and where none was stated the reviewers chose the most clinically relevant outcome by consensus - so some of these power figures are calculated against an outcome the reviewers selected rather than the one the trialists intended
- A priori threshold for acceptable power was 80 percent, that is a BETA (type-II error) of 0.20 or less
What's Wrong with Bonferroni Adjustments
- Routine Bonferroni correction is often too conservative and inflates the Type II error rate
- Bonferroni controls the family-wise error rate but reduces power to detect real effects
- The pre-specified primary outcome does not require multiplicity adjustment
- Hypothesis-driven secondary outcomes should be reported with effect sizes and interpreted cautiously rather than mechanically corrected
- What constitutes the relevant family of tests is itself ambiguous, making blanket correction problematic
Multiplicity in Randomised Trials II: Subgroup and Interim Analyses
- Testing enough subgroups guarantees a false-positive (Type I) result by chance alone
- Subgroup claims should rest on tests of interaction, not separate within-subgroup p-values
- Repeated interim looks inflate the false-positive rate unless formal stopping rules are used
- O'Brien-Fleming and Peto group-sequential boundaries preserve the intended alpha and power
- Trials stopped early for benefit systematically exaggerate the treatment effect (a random high)