False Positives | False Negatives | Error Rates
Error Types by Truth
Critical Must-Knows
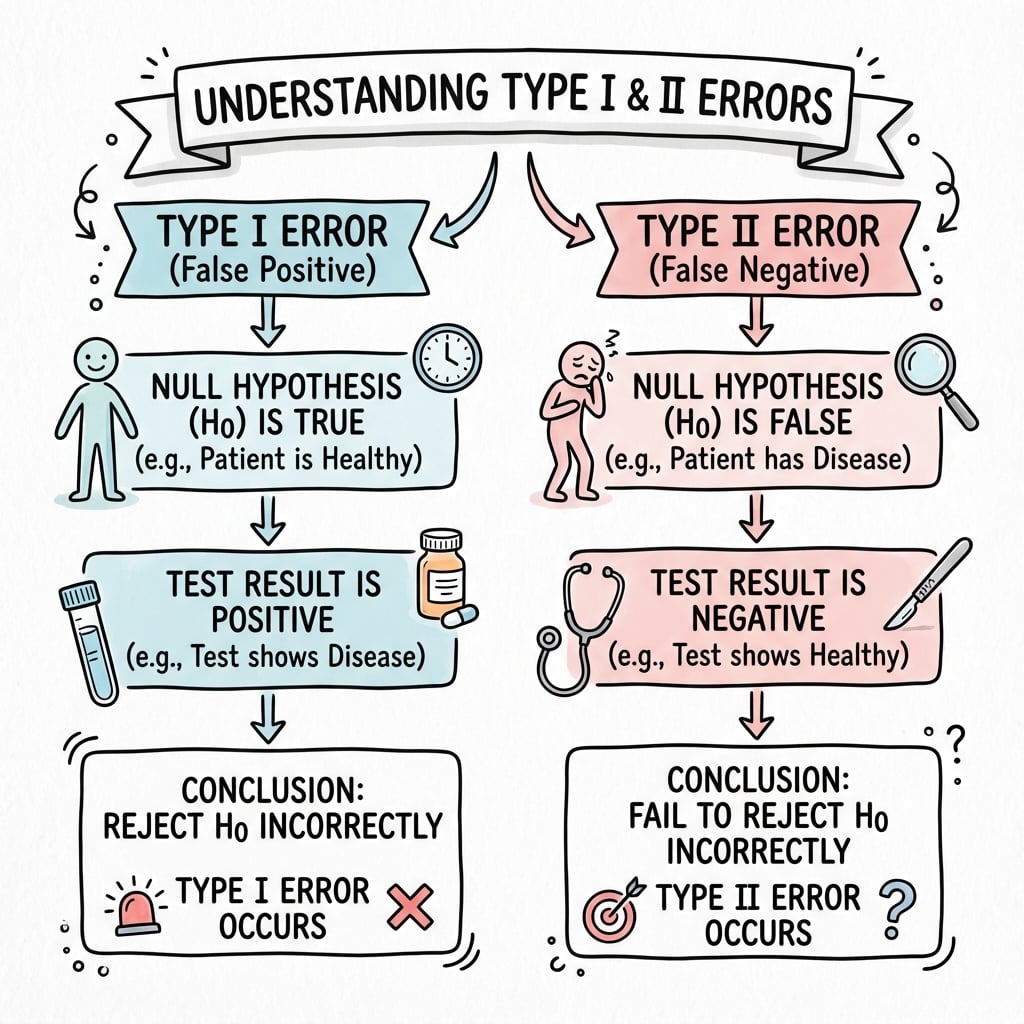
- Type I Error (Alpha): Concluding there IS an effect when there is NOT (false positive). Set before study, usually 0.05.
- Type II Error (Beta): Concluding there is NO effect when there IS (false negative). Related to power: Power = 1 minus Beta.
- Trade-off: Reducing alpha (e.g., 0.01) reduces Type I error but increases Type II error risk unless sample size increases.
- Clinical Consequences: Type I leads to adopting ineffective treatments; Type II leads to discarding effective treatments.
- Multiple Comparisons: Testing many hypotheses inflates Type I error (family-wise error) - need correction (Bonferroni).
Clinical Pearls
- "Alpha is set BEFORE study (usually 0.05), p-value is calculated AFTER from data
- "Underpowered studies have high Type II error risk - may miss real treatment effects
- "Type I error is considered worse in many contexts - adopting harmful treatment worse than missing beneficial one
- "Multiple testing without correction can inflate Type I error above 0.05
Clinical Imaging
Imaging Gallery
Critical Error Concepts
Type I Error (False Positive)
Definition: Rejecting null hypothesis when null is actually true. Example: Concluding new treatment is better when it actually is not. Alpha = 0.05 accepts 5% risk.
Type II Error (False Negative)
Definition: Failing to reject null when alternative is true. Example: Concluding treatments are equivalent when new treatment is actually better. Beta = 0.20 (power 80%) accepts 20% risk.
Alpha-Beta Trade-off
Relationship: Reducing alpha (stricter threshold) increases beta (Type II error risk) unless sample size increases. Cannot minimize both errors simultaneously with fixed sample.
Clinical Consequences
Type I Consequence: Adopt ineffective or harmful treatment. Type II Consequence: Discard effective treatment. Which is worse depends on context - severity of disease, treatment risks.
CRWAType I vs Type II Errors
| C | Crying Wolf Type I = False alarm (say difference exists when it does not) |
| R | Reality check Check if null is actually true - if yes and you reject, Type I error |
| W | Wolf present but missed Type II = Missing real threat (say no difference when there is one) |
| A | Acceptance when shouldn't Accept null when alternative is true = Type II error |
| C | Crying Wolf Type I = False alarm (say difference exists when it does not) | W | Wolf present but missed Type II = Missing real threat (say no difference when there is one) |
| R | Reality check Check if null is actually true - if yes and you reject, Type I error | A | Acceptance when shouldn't Accept null when alternative is true = Type II error |
Hook:The Boy Who Cried Wolf - Type I is crying wolf falsely (false positive), Type II is missing the real wolf (false negative)!
PAWSError Consequences and Prevention
| P | Pre-set Alpha Set Type I error rate before study (usually 0.05) |
| A | Adequate Power Ensure 80% power to minimize Type II error (beta = 0.20) |
| W | Watch Multiple Comparisons Bonferroni correction for multiple tests to control Type I error |
| S | Sample Size Larger sample reduces both errors (mainly impacts Type II) |
| P | Pre-set Alpha Set Type I error rate before study (usually 0.05) | W | Watch Multiple Comparisons Bonferroni correction for multiple tests to control Type I error |
| A | Adequate Power Ensure 80% power to minimize Type II error (beta = 0.20) | S | Sample Size Larger sample reduces both errors (mainly impacts Type II) |
Hook:Use your PAWS to prevent errors - proper planning prevents poor performance!
Overview/Introduction
What is Type I Error?
Definition: Rejecting the null hypothesis when the null hypothesis is actually true.
Common Name: False Positive
Example: Concluding a new surgical technique is superior when it actually has no benefit.
Consequences:
- Adopt ineffective or harmful treatment
- Waste resources implementing change
- Potential harm to patients
- False confidence in intervention
Alpha Level Selection
Alpha Thresholds and Implications
| Alpha | Type I Error Risk | When Used | Trade-off |
|---|---|---|---|
| 0.01 | 1% false positive rate | When Type I error is very costly (e.g., drug approval) | Requires larger sample or accepts higher Type II error |
| 0.05 | 5% false positive rate | Conventional in most research | Balance between Type I and Type II errors |
| 0.10 | 10% false positive rate | Exploratory or pilot studies | Easier to find significance but higher false positive risk |
Key Point: Alpha is set BEFORE the study. The p-value is calculated AFTER from the data. If p less than alpha, reject null.
Principles of Error Testing
Core Principles
The Error Trade-Off:
- Decreasing Type I error (lower alpha) increases Type II error risk
- Decreasing Type II error (higher power) increases sample size needed
- Cannot minimize both simultaneously without increasing sample size
Control Strategies:
- Type I (Alpha): Pre-specify alpha, use appropriate corrections for multiple testing
- Type II (Beta): Adequate sample size, appropriate effect size assumptions
Clinical Decision Framework: When is each error more serious?
- Type I more serious: Invasive treatment, irreversible decision, expensive intervention
- Type II more serious: Missing life-saving treatment, rare disease with few options
Understanding these principles guides appropriate study design.
Understanding Type II Error (Beta)
What is Type II Error?
Definition: Failing to reject the null hypothesis when the alternative hypothesis is actually true.
Common Name: False Negative
Example: Concluding two treatments are equivalent when one is actually superior.
Consequences:
- Discard effective treatment
- Delay progress in patient care
- Wasted research effort (failed trial)
- Miss therapeutic opportunity
Relationship to Power: Power = 1 minus Beta
Beta and Power
Beta and Power Relationship
| Beta | Power | Interpretation | Sample Size |
|---|---|---|---|
| 0.05 | 95% | Very high power - 95% chance detecting real effect | Very large sample needed |
| 0.10 | 90% | High power - 90% chance detecting real effect | Large sample needed |
| 0.20 | 80% | Adequate power - 80% chance detecting real effect | Moderate sample, conventional target |
| 0.50 | 50% | Underpowered - coin flip chance of detection | Small sample, high Type II error risk |
Understanding Type II error is critical for interpreting negative study results.
Error Matrix and Decision Framework
The 2x2 Truth Table
Statistical Decision vs Reality Matrix
Type I and Type II Errors
| Your Decision | Null is TRUE | Alternative is TRUE |
|---|---|---|
| Reject Null (p less than alpha) | TYPE I ERROR (False Positive) - Alpha = 0.05 | CORRECT DECISION (True Positive) - Power |
| Accept Null (p greater than alpha) | CORRECT DECISION (True Negative) - 1 minus Alpha | TYPE II ERROR (False Negative) - Beta = 0.20 |
Key Insight: We never know which column we are in (true state of nature is unknown). We set alpha and beta to control error rates.
Multiple Comparisons and Type I Error Inflation
The Multiple Testing Problem
Problem: Testing multiple hypotheses inflates overall Type I error rate.
Example: Testing 20 different outcomes at alpha = 0.05 each.
- Expected false positives: 20 × 0.05 = 1 false positive on average
- Family-wise error rate (FWER): Probability of at least one Type I error increases with each test
Formula for FWER: 1 minus (1 minus alpha)^n
- For 20 tests at alpha = 0.05: FWER = 1 minus 0.95^20 = 0.64 (64% chance of at least one false positive)
Bonferroni Correction
Method: Divide alpha by number of tests to maintain overall Type I error.
Formula: Adjusted alpha = 0.05 / n
Example: Testing 5 outcomes → Adjusted alpha = 0.05 / 5 = 0.01
- Use p less than 0.01 as threshold for each test to maintain overall Type I error at 0.05
Trade-off: Conservative - may increase Type II error (reduce power).
When to Correct for Multiple Comparisons
Correct: When testing multiple related hypotheses (e.g., multiple outcome measures in same trial).
May NOT need correction: Pre-specified primary outcome vs secondary/exploratory outcomes. Only primary outcome requires alpha = 0.05.
Understanding multiple comparisons prevents inflated Type I error rates.
Clinical Application
Which Error is Worse?
Context-Dependent: Type I (false positive) often considered worse - adopting harmful treatment. But Type II (false negative) can be worse if missing life-saving treatment. Balance depends on disease severity and treatment risk.
Screening Tests
Type I in Screening: False positive → unnecessary workup, anxiety. Type II: False negative → missed diagnosis, delayed treatment. Serious diseases (cancer) prioritize minimizing Type II (high sensitivity).
Underpowered Studies
High Beta Risk: Many orthopaedic trials underpowered (power under 80%, beta greater than 0.20). Negative results may be Type II errors. Always check power before accepting negative result.
Meta-Analysis Solution
Combining Studies: Meta-analysis increases power by pooling data from multiple studies. Reduces Type II error risk, provides more precise effect estimate.
Controversies and Areas of Uncertainty
Should alpha stay at 0.05?
A 2017 proposal argued for lowering the default threshold for new claims to 0.005 to curb false positives; critics countered this simply trades a higher Type I rate for a higher Type II rate and demands much larger samples. No global consensus exists, and 0.05 remains the working convention.
Abandon significance testing?
Some statisticians advocate retiring the word "significant" altogether in favour of estimation (effect sizes with confidence intervals) and Bayesian reasoning. Exam answers should still command the classical framework but can acknowledge this debate.
When to correct for multiplicity
Whether and how to adjust for multiple comparisons is genuinely contested (Perneger vs proponents of strict family-wise control). The defensible middle ground: pre-specify one primary outcome; treat all else as hypothesis-generating.
Post-hoc power
Calculating power after a non-significant result using the observed effect is statistically circular and discouraged - it merely re-expresses the p-value. Judge underpowering from the a priori calculation and the confidence interval width instead.
Guidelines, Registries & Global Practice
Global Reporting Standards
Error control is enforced internationally through reporting and regulatory frameworks rather than country-specific rules - the concepts are universal across FRCS, FRACS, EBOT, ABOS, DNB and SICOT curricula.
How Major Frameworks Address Type I and Type II Errors
| Framework / Body | Scope | Type I control | Type II control |
|---|---|---|---|
| CONSORT 2010 (global) | Reporting of parallel-group RCTs | Pre-specified primary outcome; declare subgroup/multiple analyses | Mandatory sample-size justification (effect size, alpha, power) |
| ICH E9 (international regulatory) | Statistical principles for clinical trials | Pre-defined analysis plan, multiplicity strategy, alpha spending | Power and sample-size assumptions stated a priori |
| FDA / EMA guidance | Drug and device approval (US / Europe) | Often demands two adequate well-controlled trials or stricter alpha | Adequate power required for pivotal endpoints |
| Cochrane / GRADE | Evidence synthesis and certainty rating | Meta-analysis reduces spurious single-study positives | Pooling raises power; imprecision downgrades certainty |
| STROBE | Observational study reporting | Encourages reporting of all analyses to limit selective positives | Reporting of study size and its rationale |
Registries and Large Datasets
National joint replacement registries (NJR for England/Wales, AOANJRR Australia, SHAR Sweden, the Norwegian and New Zealand registries, and AJRR in the US) hold hundreds of thousands of procedures. Their value for this topic is power: rare events such as implant revision are detectable with adequate precision, dramatically reducing Type II error compared with single-centre series. The trade-off is that with such large samples, trivial differences become statistically significant, so the emphasis shifts to clinical significance and effect size (e.g. hazard ratios for revision) rather than the p-value alone.
High- vs Limited-Resource Practice Variation
| Setting | Typical reality | Error implication |
|---|---|---|
| Well-resourced / registry-linked | Multicentre RCTs, registries, pre-registration | Better powered; main risk is over-interpreting tiny but significant effects (Type I in spirit) |
| Limited-resource | Small single-centre series, few RCTs | High Type II error risk; negative results frequently inconclusive |
| Global synthesis | Cochrane reviews pool across regions | Improves power and generalisability; heterogeneity must be assessed |
The teaching point is universal: interpret a "negative" study in the light of its power, and a "positive" study in the light of multiplicity and effect size - independent of country.
Evidence Base
Type-II Error Rates of Randomised Trials in Orthopaedic Trauma
- Systematic review of 117 randomised fracture-care trials (1968 to 1999) enrolling 19,942 patients
- Mean study power for the primary outcome was only 24.65 percent (range 2 to 99 percent)
- Type-II (beta) error rate for primary outcomes was 90.52 percent - the great majority were underpowered
- Sample sizes were small (mean 95 patients) and primary outcomes were often not pre-specified
- A priori threshold for acceptable power was set at 80 percent (beta 0.20 or less)
What's Wrong with Bonferroni Adjustments
- Routine Bonferroni correction is often too conservative and inflates the Type II error rate
- Bonferroni controls the family-wise error rate but reduces power to detect real effects
- The pre-specified primary outcome does not require multiplicity adjustment
- Hypothesis-driven secondary outcomes should be reported with effect sizes and interpreted cautiously rather than mechanically corrected
- What constitutes the relevant family of tests is itself ambiguous, making blanket correction problematic
Multiplicity in Randomised Trials II: Subgroup and Interim Analyses
- Testing enough subgroups guarantees a false-positive (Type I) result by chance alone
- Subgroup claims should rest on tests of interaction, not separate within-subgroup p-values
- Repeated interim looks inflate the false-positive rate unless formal stopping rules are used
- O'Brien-Fleming and Peto group-sequential boundaries preserve the intended alpha and power
- Trials stopped early for benefit systematically exaggerate the treatment effect (a random high)
Exam Viva Scenarios
Use these scenarios to practise clinical reasoning and management decisions
Scenario 1: Error Type Identification
"A study concludes that a new fixation technique reduces nonunion rates compared to standard technique (p = 0.03). However, the new technique actually has the same nonunion rate as standard. What type of error has occurred?"
Scenario 2: Multiple Comparisons
"You are reviewing an RCT that tested 10 different outcome measures. One outcome showed p = 0.04. How do you interpret this result?"
Scenario 3: Interpreting a Negative Trial
"A single-centre RCT of 40 patients compares a new locking plate with a standard plate for distal radius fractures and finds no significant difference in function (p = 0.28). The authors conclude the implants are equivalent. As the examiner asks: is that conclusion justified?"
MCQ Practice Points
Type I Error Definition
Q: What is a Type I error? A: Rejecting null hypothesis when null is actually true (false positive). Concluding there IS a difference when there is NOT. Probability is alpha (usually 0.05 or 5%).
Type II Error Definition
Q: What is a Type II error? A: Failing to reject null hypothesis when alternative is true (false negative). Concluding there is NO difference when there IS. Probability is beta (usually 0.20 or 20% for power = 80%).
Multiple Comparisons
Q: Why does testing multiple outcomes increase Type I error risk? A: Each test has 5% chance of false positive. Testing 20 outcomes means expecting 20 × 0.05 = 1 false positive on average. Family-wise error rate (probability of at least one false positive) increases with each additional test. Bonferroni correction divides alpha by number of tests to control overall Type I error.
Management Algorithm
TYPE I AND TYPE II ERRORS
Clinical summary
Error Definitions
- •Type I = False Positive = Reject null when null is true = Alpha
- •Type II = False Negative = Accept null when alternative is true = Beta
- •Power = 1 minus Beta = Probability of correctly rejecting false null
- •Alpha set BEFORE study (usually 0.05), p-value calculated AFTER from data
- •If p less than alpha, reject null (risk Type I if null actually true)
Error Consequences
- •Type I consequence = Adopt ineffective or harmful treatment
- •Type II consequence = Discard effective treatment, miss opportunity
- •Type I often considered worse (false adoption) but context-dependent
- •Screening: Type II worse for serious diseases (miss cancer)
- •Treatment: Type I worse for risky interventions (adopt harmful therapy)
Error Control
- •Reduce Type I = Lower alpha (0.01 instead of 0.05) OR increase sample
- •Reduce Type II = Increase power (0.90 instead of 0.80) OR increase sample
- •Trade-off: Lowering alpha increases beta unless sample increases
- •Conventional: Alpha = 0.05 (5% Type I), Beta = 0.20 (20% Type II, 80% power)
- •Large sample reduces both errors
Multiple Comparisons
- •Testing n outcomes inflates Type I error (family-wise error rate)
- •FWER = 1 minus (1 minus alpha)^n
- •20 tests at alpha 0.05: FWER = 64% (not 5%)
- •Bonferroni correction: Adjusted alpha = 0.05 / n
- •Primary outcome: No correction. Secondary outcomes: Correct or interpret cautiously
Clinical Application
- •Underpowered studies have high Type II error risk (beta greater than 0.20)
- •Negative result from underpowered study = Inconclusive, NOT definitive
- •Pre-specify primary outcome to avoid multiple comparison issues
- •Meta-analysis reduces Type II error by pooling studies (increases power)
- •Always check power when interpreting negative results